One of the first questions investors ask when evaluating a mobile home park deal is: what cap rate should I expect? The honest answer depends heavily on which state you are buying in, what the market dynamics look like, and how the specific asset is positioned. This guide gives you the actual data.
Below we break down mobile home park cap rates across six target states — North Carolina, Tennessee, Georgia, South Carolina, South Dakota, and Wisconsin — and explain what is driving the differences. Whether you are actively buying or building market knowledge, these ranges will anchor your underwriting in reality.
National Mobile Home Park Cap Rate Context in 2026
At the national level, stabilized mobile home park assets are trading in a wide band: roughly 4.5% to 9% depending on asset quality, location, utility infrastructure, and occupancy. Premium institutional-grade communities with 200+ lots in major metro areas can compress below 5%. Smaller communities in secondary markets with value-add upside more commonly trade at 7 to 9%.
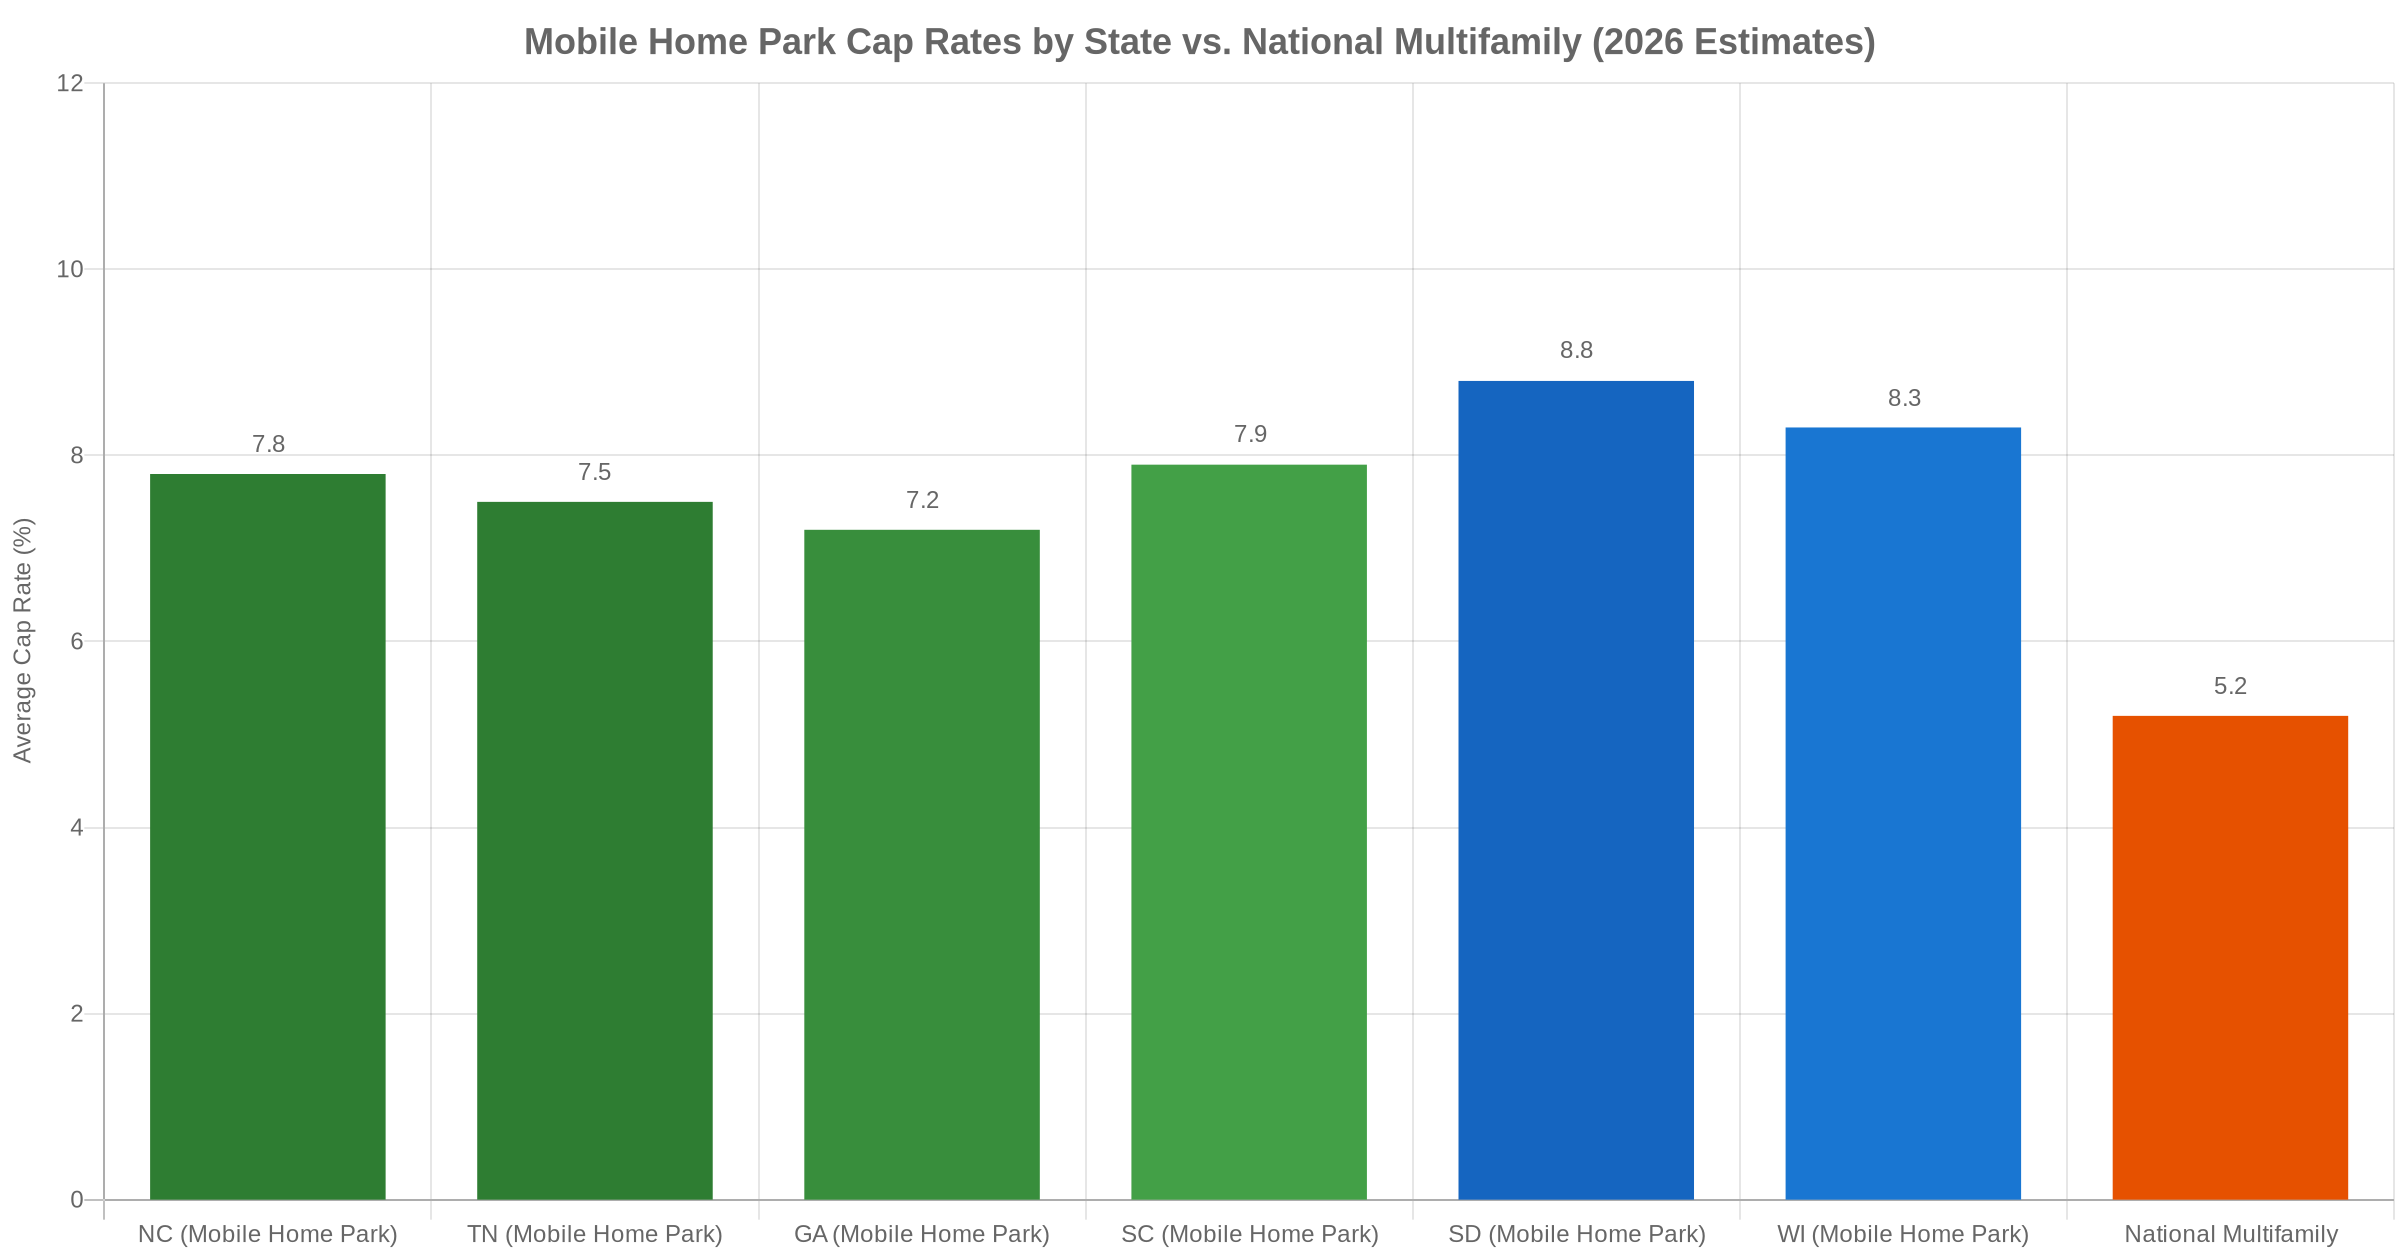
For context, national multifamily cap rates average around 5.2% in 2026, making mobile home parks broadly more attractive on a yield basis. The premium reflects the smaller buyer pool and operational requirements — but the underlying fundamentals (minimal new supply, low tenant turnover, persistent affordable housing demand) are as strong or stronger than traditional apartments.
Mobile Home Park Cap Rates by State
North Carolina: 6.5 to 9.0% (Average: ~7.8%)
North Carolina is a primary acquisition target for experienced mobile home park investors. The state combines strong population growth in Charlotte, Raleigh, Greensboro, and Asheville with a business-friendly regulatory environment and no statewide rent control. Charlotte metro is adding roughly 100 new residents per day, keeping manufactured housing demand consistently elevated.
Stabilized mobile home parks with 70+ lots on city water and sewer in NC commuter markets typically land between 7% and 8.5%. Parks in Charlotte or Research Triangle suburbs are compressing toward 6.5 to 7%. More rural areas 45 to 60 minutes outside those metros offer 8 to 9%, often with lot rent upside that makes the forward yield even stronger.
For more detail, see our Mobile Home Park Investing in North Carolina: 2026 Market Guide.
Tennessee: 7.0 to 8.5% (Average: ~7.5%)
Tennessee is a top-tier Southeast market for mobile home park investors. Nashville, Knoxville, and Chattanooga are experiencing sustained in-migration from higher-cost coastal states, and the absence of state income tax makes Tennessee attractive to both residents and investors. That demand dynamic supports occupancy stability and lot rent growth over time.
Mobile home park cap rates in Tennessee cluster between 7% and 8.5% for stabilized assets outside the core Nashville metro. Parks within Nashville proper have compressed meaningfully, with buyers accepting lower in-place yields in exchange for strong rent growth trajectory and exit cap rate compression potential.
See our Mobile Home Park Investing in Tennessee: 2026 Market Guide for the full picture.
Georgia: 6.8 to 8.5% (Average: ~7.2%)
Georgia’s growth story is anchored in Atlanta metro, but solid deal flow exists in secondary markets including Macon, Augusta, Savannah, and the corridor between Atlanta and Chattanooga. Atlanta-adjacent mobile home parks have seen significant cap rate compression as institutional buyers have expanded their Southeast footprint and competed for well-located assets.
Expect 6.8 to 8.5% for stabilized Georgia assets. Parks with city utilities and strong occupancy near Atlanta suburbs sit at the low end. Rural central Georgia parks with value-add potential — below-market rents, vacant lots to fill — can offer 8 to 8.5% on current net operating income with meaningful upside built in.
South Carolina: 7.0 to 9.0% (Average: ~7.9%)
South Carolina combines multiple demand drivers: the Greenville-Spartanburg Upstate market is among the fastest-growing metros in the Southeast while remaining affordable to residents, and coastal markets like Charleston and Myrtle Beach benefit from consistent retiree and remote-worker migration. Cap rates in SC stay slightly above NC given lower transaction velocity — fewer competing buyers on each deal.
Stabilized South Carolina mobile home parks on public utilities typically trade at 7 to 9%. The Greenville-Spartanburg corridor is seeing the most deal activity and the most notable cap rate compression over the past two years.
Two decades of hard-won lessons distilled into one free guide. Whether you’re evaluating your first deal or your fiftieth, these insights will sharpen your approach.
Higher-Yield Markets: South Dakota and Wisconsin
South Dakota: 8.0 to 10.5% (Average: ~8.8%)
South Dakota represents a fundamentally different investment thesis: higher cap rates in exchange for smaller market populations and a different appreciation profile. No state income tax, low regulatory burden, and minimal tenant protection legislation make it a favorable operating environment for mobile home park owners. Rapid City and Sioux Falls are the primary markets worth targeting.
Cap rates of 8 to 10.5% are common for well-maintained South Dakota mobile home parks, with properties in smaller communities sometimes exceeding 10%. Investors buying here are typically playing a yield-focused, cash flow-first strategy rather than banking on appreciation.
Wisconsin: 7.5 to 10.0% (Average: ~8.3%)
Wisconsin offers some of the most attractive entry cap rates among target markets, particularly in the Fox Valley corridor (Appleton, Green Bay) and markets south of Milwaukee. Madison metro mobile home parks have compressed toward 7.5 to 8%, while more rural Wisconsin properties regularly trade at 9 to 10%.
Worth noting: Wisconsin has more active tenant protection legislation discussions than Southern states. Buyers should underwrite regulatory risk and stay current on any pending Wisconsin mobile home park legislation before closing. That risk premium is part of why yields remain elevated — and for informed operators, it creates real opportunity.
What Drives Cap Rate Differences Within a State
Cap rate is not just a geographic number. It reflects property-specific factors that can move a deal 100 to 200 basis points in either direction within the same market:
- City utilities vs. private well/septic: Mobile home parks on city water and city sewer command lower, tighter cap rates. Private utilities add operational risk and discount valuations — sometimes significantly.
- Occupancy rate: Parks at 95%+ occupancy near market rents compress cap rates. Parks with significant vacancies or below-market rents show higher cap rates but carry turnaround risk that the yield does not always compensate for.
- Tenant-owned vs. park-owned homes: Tenant-owned home (TOH) dominant mobile home parks trade at tighter cap rates because operating expense ratios run 30 to 35% versus 55 to 65% for park-owned home (POH) heavy properties. See our breakdown: Tenant-Owned Homes vs. Park-Owned Homes: What Every Mobile Home Park Investor Needs to Know.
- Lot rent vs. market: When lot rents are 15 to 20% below market, sophisticated buyers underwrite to market rents on a forward basis. The in-place cap rate looks artificially high, but that spread is real upside only if rents can be raised without triggering occupancy loss.
- Park size: 100+ lot mobile home parks typically trade at tighter cap rates because institutional buyers compete for scale assets. Smaller parks (50 to 80 lots) in the same market frequently offer 75 to 150 basis points more yield — often representing the best entry point for independent operators.
For a deeper dive on using cap rates in deal analysis, see Mobile Home Park Cap Rates Explained: What Is a Good Cap Rate in 2026?
Cap Rates and Financing: The Debt Coverage Reality
Cap rates do not exist in isolation — they interact directly with your debt terms. When agency debt (Fannie Mae or Freddie Mac programs) prices at 6 to 7% and you are buying at a 7% cap rate, your debt coverage ratio is thin. There is minimal cushion between your yield and cost of capital. At an 8.5% cap rate with comparable debt, you have meaningful positive leverage and substantially stronger cash-on-cash returns from day one.
This is why higher-cap-rate markets like South Dakota and Wisconsin can produce better cash flow numbers than Sun Belt deals, even when the long-term appreciation story is more modest. It is also why deal structure — seller financing, bridge loans, and creative terms — matters enormously in cap rate-compressed markets where the spread between yield and debt cost has narrowed.
For a full breakdown of financing structures and how they affect returns, see our Mobile Home Park Financing Guide 2026: Every Loan Type Compared.
Conclusion: Cap Rates as Context, Not a Shortcut
Cap rates by state give you essential context for evaluating any mobile home park deal — but they are a starting point, not a substitute for deep analysis. A 7.5% cap rate in a high-growth North Carolina market with a clear path to lot rent increases and exit cap rate compression could outperform a 9.5% cap rate deal in a flat Midwest market on every meaningful return metric over a 5 to 7 year hold.
The skill that separates good mobile home park investors from great ones is not finding the highest cap rate. It is understanding which cap rate reflects genuine value — and which one reflects risk the seller has already priced in for a reason.
10 video modules, a 55-page master checklist, and 9 ready-to-use templates that walk you through every step of evaluating a mobile home park deal — from the first site visit to closing day.
Frequently Asked Questions: Mobile Home Park Cap Rates by State
What is a good cap rate for a mobile home park in 2026?
Most investors target 7 to 9% for stabilized mobile home parks in secondary and tertiary markets. Parks in high-growth Sun Belt metros may trade at 6 to 7.5%, while rural Midwest markets can offer 9 to 10%+. A good cap rate depends on your debt terms, hold strategy, and the market’s rent growth trajectory.
Are mobile home park cap rates higher than apartment cap rates?
Yes. Mobile home parks nationally average 7 to 9% cap rates compared to roughly 5 to 5.5% for stabilized multifamily in 2026. The yield premium reflects the smaller institutional buyer pool and operational requirements, but the underlying structural fundamentals of mobile home parks are as strong or stronger than traditional apartments.
Which states have the highest mobile home park cap rates?
Generally, Midwest and Plains states like South Dakota, Wisconsin, Indiana, and Ohio offer the highest mobile home park cap rates, typically 8 to 11% for stabilized assets. Sun Belt states like North Carolina, Tennessee, and Georgia offer more moderate cap rates (7 to 9%) but stronger appreciation potential and lot rent growth over time.
How does cap rate compression create returns in mobile home park investing?
Cap rate compression means the market values your property at a lower yield over time as demand for the asset class increases. If you buy a mobile home park generating $150,000 in annual net operating income at an 8% cap rate ($1.875M purchase price) and later sell at a 6.5% cap rate, that same NOI produces a value of $2.31M — a $435,000 gain from compression alone, before any income growth.
How do I find mobile home parks trading at these cap rates?
The best mobile home park deals in the 7 to 9% range with real value-add upside typically come through off-market, direct-to-owner outreach rather than broker-listed transactions. Broker-listed deals in competitive markets often trade at compressed cap rates because multiple buyers compete for them. A systematic approach to direct mail, skip tracing, and owner relationship building in target markets gives independent operators access to better-priced assets in any of these states.
Get the top 20 lessons from two decades of mobile home park investing — free.