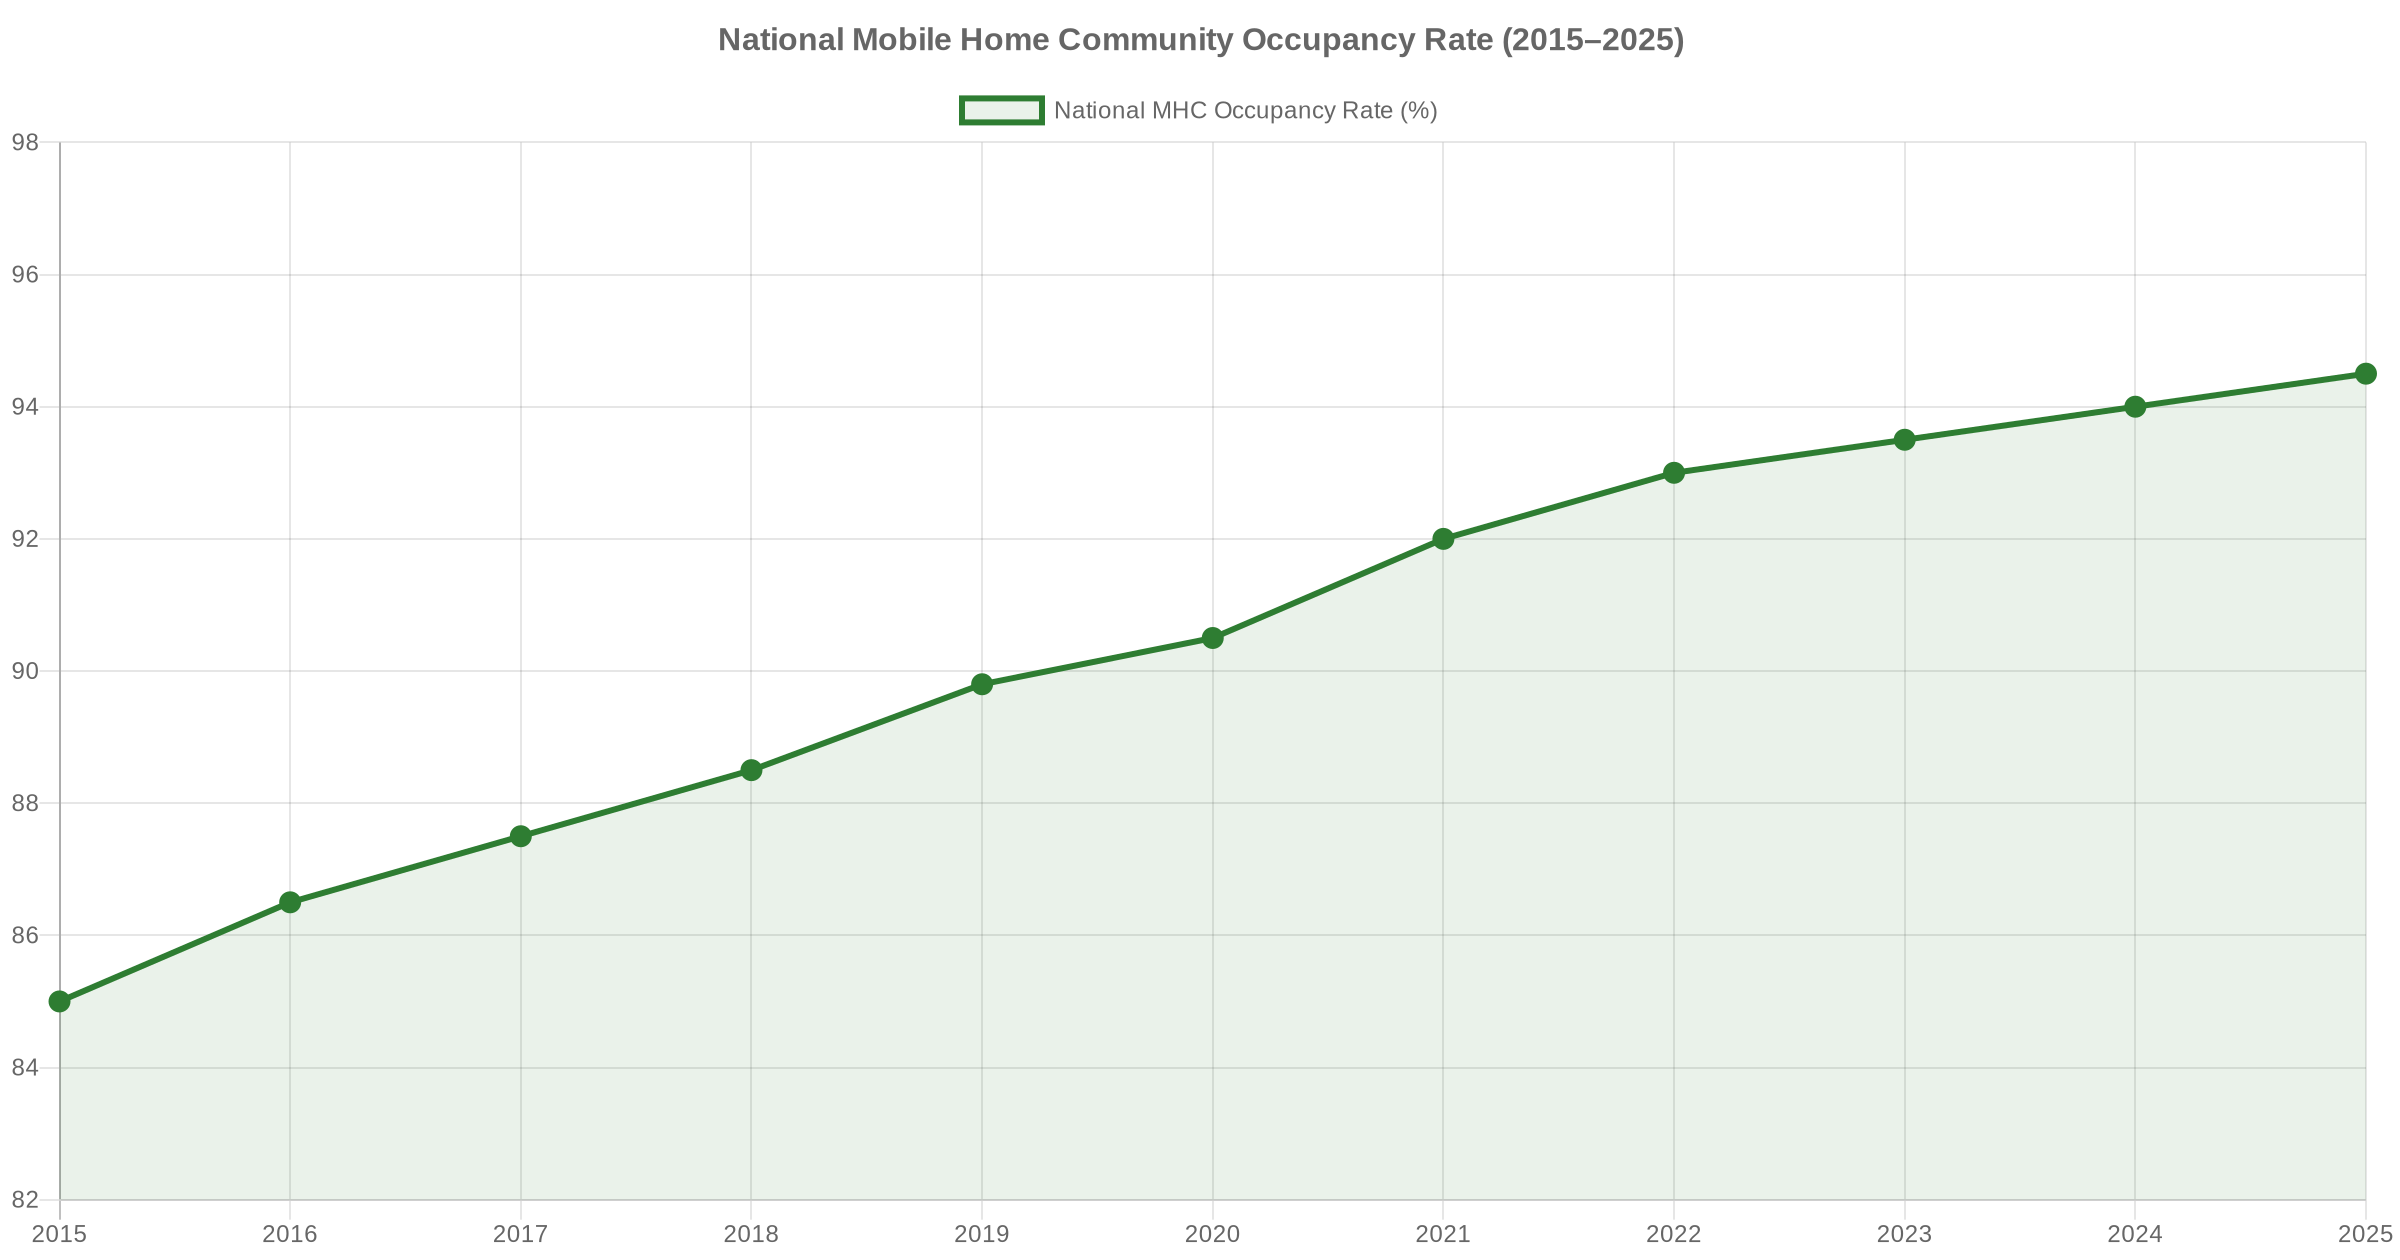
If there is one metric that quietly explains why experienced real estate investors have been rotating into mobile home park communities over the past decade, it is occupancy. National mobile home community occupancy has climbed from roughly 85% in 2015 to approximately 94.5% in 2025 — and in the tightest regional markets, communities routinely operate above 98%. For investors evaluating deals in 2026, understanding what these numbers mean, why they got here, and how they affect valuations is foundational knowledge.
What Is the Average Mobile Home Park Occupancy Rate in 2026?
As of the most recent full-year data, the national average occupancy rate across manufactured housing communities sits in the 93%–94.5% range — a figure drawn from analysis by Northmarq, Berkadia, and MHInsider. This is not a soft indicator. Across the nearly 45,000 land-lease communities operating in the United States, the vast majority of lots are occupied, with demand continuing to outpace the essentially flat supply of new communities.
Compare this to the multifamily apartment market, where national vacancy rates have hovered around 6%–8% in recent years — and that number has been climbing as a wave of new apartment construction delivers supply into markets that haven’t fully absorbed it. Mobile home park communities benefit from the opposite dynamic: almost no new supply, and steady demand fueled by the national affordability crisis.
Why Occupancy Has Climbed Steadily Over the Past Decade
The structural drivers behind mobile home park occupancy growth are not difficult to explain — they are simply often overlooked by investors focused on traditional asset classes.
- Zero new supply. Approximately 20 new manufactured housing communities open each year across the entire United States, representing roughly 0.04% of existing stock. Zoning hostility, NIMBY opposition, and prohibitive land costs have made new development nearly impossible in most markets. When supply cannot grow, occupancy tightens.
- Persistent affordability pressure. With the median U.S. home price exceeding $400,000 and apartment rents well above $1,500 per month in most metros, manufactured housing communities offering lot rents in the $400–$800 range represent one of the last remaining forms of unsubsidized affordable housing. Demand is structurally driven, not cyclical.
- Low tenant turnover. Mobile home park residents own their homes and rent the land beneath them. Moving a manufactured home costs $5,000 to $15,000 or more — a significant deterrent to relocating. Annual home turnover rates in mobile home park communities typically run around 2.2%, versus roughly 47% in apartments. Residents stay. Lots stay occupied.
- Improved community quality. A wave of professional operators entering the space over the past decade has upgraded infrastructure, improved management, and raised the quality of resident experience — which in turn drives longer tenure and higher occupancy at stabilized communities.
Regional Occupancy Benchmarks: Where Markets Are Tightest
National averages mask significant regional variation. Investors evaluating mobile home park opportunities in 2026 should understand where their target markets fall on the occupancy spectrum:
- Pacific Coast (CA, WA, OR): Approximately 99% occupancy — the tightest market in the country by a wide margin. The extreme housing affordability crisis in coastal metros has made manufactured housing communities essentially waitlist-only in many areas.
- Southeast (NC, SC, GA, TN, FL): Averaging 93%–96%, with Florida reporting some markets at 97%+. Population migration into Sun Belt metros continues to absorb available lots. Annual lot rent growth in Florida has averaged 5.5%–11% in recent years.
- Midwest (WI, SD, MN, OH): Typically 90%–94%. More modest rent growth but stable demand tied to manufacturing employment bases and aging housing stock in secondary markets.
- Mountain West and Plains: Wide variability — 88%–95% depending on proximity to economic drivers. Markets like Boise, Denver suburbs, and Colorado Springs are approaching coastal-level tightness; rural areas have more availability.
For investors focused on North Carolina and Tennessee — two of the strongest acquisition markets in the Southeast — current occupancy benchmarks suggest stabilized communities in the 93%–96% range, with value-add communities in the 75%–85% range presenting meaningful upside through infill and operational improvement. See our detailed breakdowns in our Mobile Home Park Cap Rates by State in 2026 guide.
How Occupancy Rates Directly Impact NOI and Valuation
In a mobile home park community operating on a lot-rent model, every occupied lot generates direct revenue. Every empty lot is dead weight — it contributes nothing to gross income while the underlying land, infrastructure, and overhead costs remain constant. The math is unforgiving.
Here is a simplified example. A 100-lot mobile home park community charging $600/month in lot rent:
- At 95% occupancy (95 lots): $57,000/month gross lot rent
- At 85% occupancy (85 lots): $51,000/month gross lot rent — a $72,000/year revenue gap
- At 75% occupancy (75 lots): $45,000/month — $144,000/year below a stabilized community
When you capitalize that $72,000 NOI difference at a 7% cap rate, occupancy moving from 85% to 95% adds over $1 million in value to a single 100-lot community. This is why the mobile home park valuation of a community is so sensitive to occupancy assumptions in underwriting.
Two decades of hard-won lessons distilled into one free guide. Whether you’re evaluating your first deal or your fiftieth, these insights will sharpen your approach.
What’s a “Good” Occupancy Rate When Evaluating a Deal?
This depends entirely on the deal structure and your investment thesis:
- Stabilized acquisition (90%–95%+ occupancy): You are buying cash flow with limited upside from occupancy improvement. Underwrite conservatively on lot rent growth and expense ratios. A well-run community at 93% with city utilities and a strong local market is a fundamentally sound investment.
- Value-add acquisition (70%–85% occupancy): You are buying the gap between current NOI and stabilized NOI. The spread in cap rate between an 80%-occupied community and a 95%-occupied one in the same market can be 200–400 basis points. If you can close that gap efficiently, this is where outsized returns are made.
- Turnaround (below 70%): Approach with caution unless you have deep operational experience. Communities below 70% occupied often have structural issues — deferred infrastructure, problematic tenant mix, or physical lot problems that prevent infilling. Thorough due diligence is essential before committing capital to a sub-70% asset.
Value-Add Opportunity: When Low Occupancy Is a Feature, Not a Bug
Many experienced mobile home park operators actively seek communities with 15%–25% vacancy because the path to value creation is clear and executable. The playbook typically involves:
- Identifying root cause. Is vacancy due to deferred maintenance, poor management, wrong pricing, lack of homes, or a combination? The fix depends on the diagnosis.
- Deploying infill homes. Working with manufactured home dealers or lease-to-own programs to place homes on vacant lots. This is the single highest-return activity in mobile home park operations. See our full breakdown of how to work with dealers to fill vacant lots.
- Converting park-owned homes to tenant-owned homes. Operators running park-owned homes at 55%–60% expense ratios can dramatically improve NOI by transitioning homes to resident ownership over a 3–5 year hold. Read our detailed comparison of tenant-owned vs. park-owned homes.
- Improving management and curb appeal. Communities with clean common areas, responsive management, and fair rules attract and retain better residents — which accelerates organic occupancy growth.
A realistic timeline for improving occupancy from 80% to 90%+ in a 100-lot community with disciplined execution is 24–36 months. That timeframe aligns with the typical 5–7 year hold period of a mobile home park investment, leaving runway for occupancy stabilization before an exit.
How Experienced Operators Drive Occupancy Above 95%
Communities operating above 95% rarely get there by accident. The common threads among high-occupancy operators:
- Waitlists. Operators who maintain a waiting list of prospective residents fill vacancies within weeks, not months. This requires proactive community marketing and a reputation for responsive management.
- Rapid home placement. When a home leaves a lot, the clock starts. Operators with pre-established dealer relationships can have a replacement home on that lot within 60–90 days.
- Lot rent aligned to market. Communities charging significantly below market lot rent attract more applicants than they can accommodate. While below-market rents represent an NOI gap, they also create a natural demand buffer that keeps occupancy high. Raising rents to market while retaining residents requires careful execution.
- Stable utilities. City water and city sewer — as opposed to well/septic systems — dramatically reduce infrastructure headaches that can displace residents and create vacancies. This is a core criterion in deal screening for experienced operators.
Frequently Asked Questions About Mobile Home Park Occupancy Rates
What is the average occupancy rate for mobile home parks in the U.S.?
As of the most recent full-year data (2025), the national average occupancy rate for manufactured housing communities is approximately 93%–94.5%. This varies by region, with Pacific Coast markets at or above 99% and some Midwest tertiary markets running closer to 88%–90%.
How does mobile home park occupancy compare to apartments?
Mobile home park communities significantly outperform apartments on occupancy. National apartment vacancy typically runs 6%–8%, and has been rising as new apartment supply enters the market. Mobile home park communities benefit from near-zero new supply and sticky resident tenure, which structurally supports higher occupancy through economic cycles — including recessions.
What occupancy rate should I look for when buying a mobile home park?
It depends on your strategy. Stabilized investors typically look for communities at 88%–95%+ occupancy. Value-add investors intentionally seek communities in the 70%–85% range where operational improvement can create equity. Communities below 70% require careful due diligence to identify structural issues that may make stabilization difficult or costly.
How does occupancy affect mobile home park valuation?
Occupancy directly drives gross income, which drives net operating income (NOI), which is then capitalized to determine value. A 10-percentage-point improvement in occupancy on a 100-lot community charging $600/month in lot rent increases annual NOI by approximately $72,000 — which at a 7% cap rate translates to over $1 million in value creation.
Which states have the highest mobile home park occupancy rates?
Pacific Coast states (California, Washington, Oregon) consistently report the highest occupancy, with many communities at or above 99%. In the Southeast, Florida leads with high occupancy driven by population growth and strong lot rent growth rates. North Carolina, Tennessee, Georgia, and South Carolina are all performing at or above the national average, making the Southeast a particularly attractive region for mobile home park investment in 2026.
Occupancy is one of the most powerful indicators of mobile home park community health — and one of the clearest signals of value creation potential. Whether you are evaluating a stabilized acquisition or a turnaround opportunity, understanding occupancy trends at the national, regional, and property level gives you a meaningful edge in underwriting and negotiating deals.
10 video modules, a 55-page master checklist, and 9 ready-to-use templates that walk you through every step of evaluating a mobile home park deal — from the first site visit to closing day.
Get the top 20 lessons from two decades of mobile home park investing — free.