
If you’re evaluating a mobile home park investment in 2026, one of the most critical data points isn’t the cap rate or the occupancy rate — it’s the lot rent, and more specifically, how fast it’s growing. Lot rent is the recurring monthly payment residents make to keep their home on the land inside a mobile home park. It’s the engine behind every mobile home park investment’s cash flow, and its growth trajectory varies significantly by state.
This post breaks down mobile home park lot rent growth by state, using 2026 market data to help investors understand where rent is accelerating — and why.
Why Lot Rent Growth Matters for Mobile Home Park Investors
Unlike apartment leases where both the unit and the land are tied together, mobile home park investors own the land beneath homes that residents own themselves. This structure creates a powerful dynamic: residents rarely move because the cost and logistics of relocating a manufactured home are prohibitive. That stickiness gives operators consistent pricing power — and it means rent increases flow almost entirely to the bottom line.
Annual lot rent growth translates nearly dollar-for-dollar into net operating income (NOI) expansion. If a 100-lot mobile home park is generating $50,000 per month in gross lot rent and the operator raises rents by 5%, that’s $30,000 in additional annual revenue — most of which flows through to NOI with minimal incremental expense. When NOI rises and cap rates stay flat, the asset’s value increases proportionally.
For passive investors evaluating a syndication, understanding the gap between a park’s current lot rents and true market rents is one of the most important inputs in underwriting the deal’s upside. Mobile home park cap rates vary by state, and so does the organic rent growth runway that drives value creation over a hold period.
National Lot Rent Averages in 2026
According to Berkadia’s 2025 Manufactured Housing Annual Report, the national average lot rent for a manufactured housing community sits at approximately $752 per month — a figure that has grown steadily over the past decade as affordable housing demand has outpaced supply across virtually every major U.S. market.
That national average, however, masks significant regional divergence. Coastal and Sun Belt states command well above-average lot rents, while Midwest and Great Plains markets tend to run lower — but often offer stronger rent growth runway because rents remain significantly below what the market can genuinely support.
For investors, the most actionable data isn’t just where average rents sit today. It’s the year-over-year growth rate combined with the below-market gap, which together define the total rent growth opportunity available on any given acquisition.
Two decades of hard-won lessons distilled into one free guide. Whether you’re evaluating your first deal or your fiftieth, these insights will sharpen your approach.
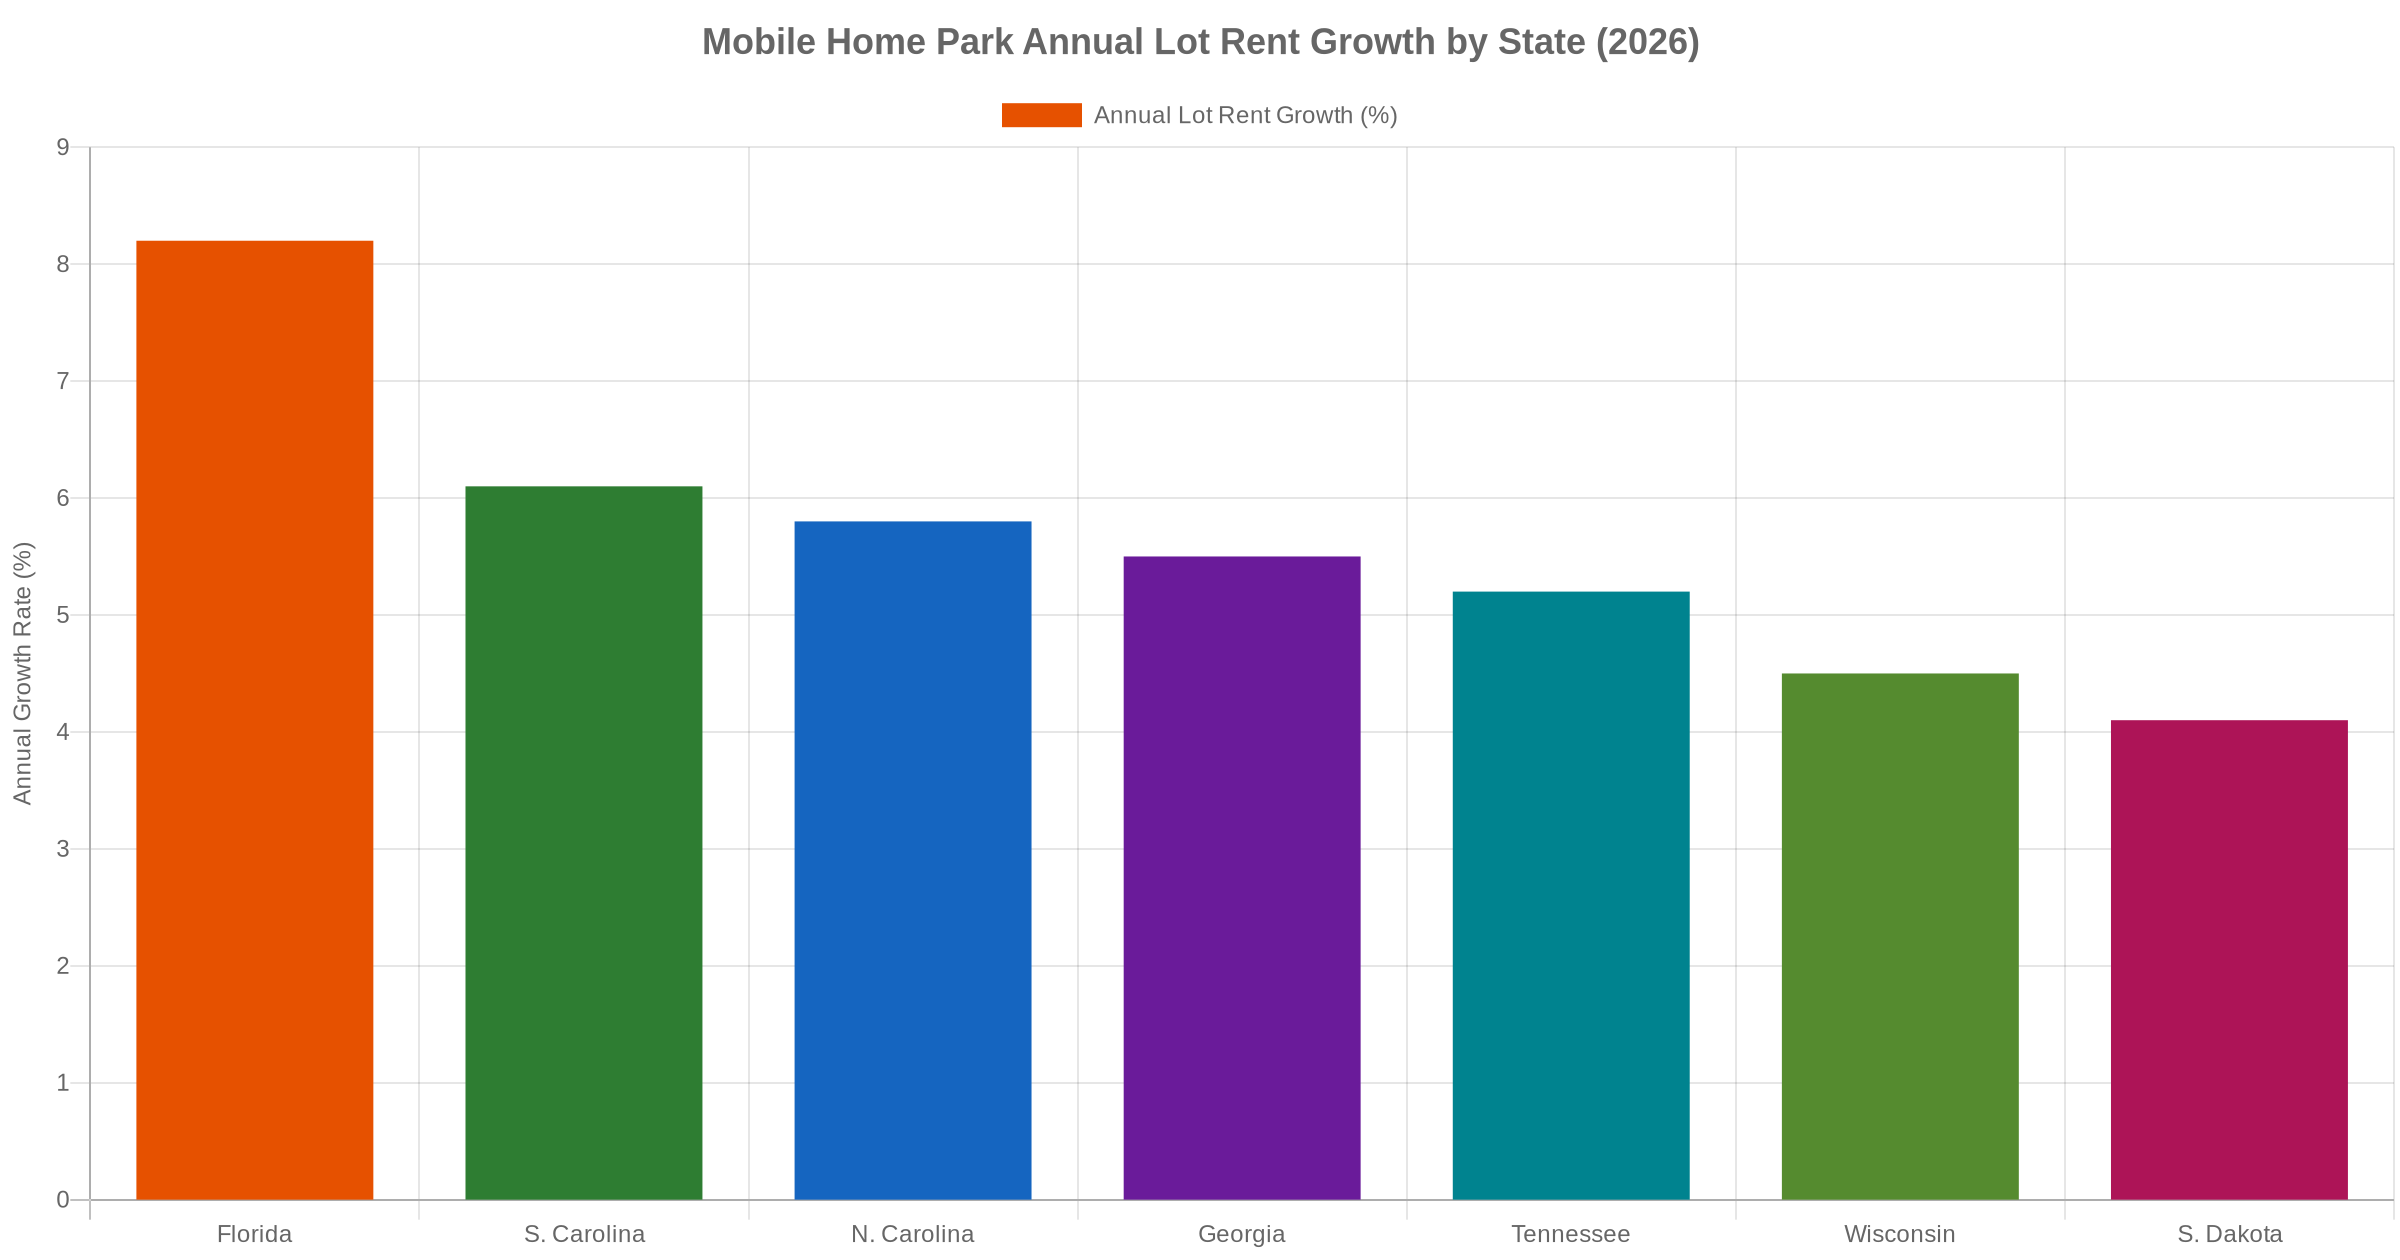
Mobile Home Park Lot Rent Growth by State: The 2026 Breakdown
Here’s a data-driven look at annual lot rent growth rates across key mobile home park investment states in 2026, drawing from Berkadia, Northmarq, and Matthews Real Estate Intelligence data.
Florida
Florida is the hottest lot rent market in the country. According to Matthews Real Estate Intelligence, Florida lot rents are growing at 5.5% to 11% annually, depending on the submarket — with coastal metros like Tampa, Fort Lauderdale, and Orlando driving the upper range. Tampa’s population growth alone (approximately 1.9% year-over-year) is sustaining demand at a remarkable pace. Average lot rents in premium Florida communities now exceed $900 per month in many markets, with well-located communities trading at cap rates of 4.5% to 6%.
North Carolina
North Carolina is a standout performer among Southeast markets, with annual lot rent growth averaging 5.5% to 6% across the state. Charlotte and Raleigh’s continued population inflows — both metros rank among the top 10 fastest-growing in the U.S. — are pressuring affordable housing supply and pushing lot rents higher. Current market lot rents for well-located North Carolina mobile home parks range from $420 to $560 per month, with significant below-market rent opportunities still available for value-add operators. Our North Carolina mobile home park investing guide covers the full market picture in detail.
Tennessee
Tennessee is posting strong results driven by Nashville’s explosive growth and Knoxville’s expanding tech and healthcare employment base. Annual lot rent growth is tracking at 4.8% to 5.5%, with average lot rents ranging from $400 to $510 per month. Tennessee’s business-friendly regulatory environment, zero state income tax, and consistent in-migration from higher-cost states make it one of the top acquisition markets in the Southeast for experienced operators. See our Tennessee mobile home park investing guide for a full breakdown of submarkets and deal flow.
Georgia
Georgia’s mobile home park market, anchored by Atlanta’s severe affordable housing shortage, is posting lot rent growth in the 5% to 5.5% range. Atlanta’s rapid expansion has pushed housing costs higher across every segment of the market, benefiting manufactured housing communities as the most affordable option for working-class households. Lot rents in Georgia range from $380 to $530 per month depending on proximity to the Atlanta metro and other major MSAs like Savannah and Augusta.
South Carolina
South Carolina is a strong emerging market, with lot rents growing at 5.5% to 6% annually — driven partly by migration overflow from the Charlotte metro and coastal demand in Charleston and Myrtle Beach. Greenville-Spartanburg stands out as a particularly active submarket for manufactured housing investment, with a manufacturing and logistics workforce that creates stable, long-term demand for affordable housing. Current lot rents range from $360 to $520 per month.
South Dakota
South Dakota offers a different value proposition. Lot rent growth is more moderate at 3.8% to 4.5%, but cap rates run significantly higher (8% to 10.5%) than Sun Belt markets. For investors prioritizing cash-on-cash yield over appreciation, South Dakota’s low regulatory burden and stable workforce housing demand make it an attractive addition to a diversified portfolio. Average lot rents typically range from $360 to $440 per month.
Wisconsin
Wisconsin rounds out the picture with annual lot rent growth of 4% to 4.8%. Milwaukee and Madison submarkets are the primary growth drivers, with rural Wisconsin offering lower entry prices but thinner growth trajectories. Average lot rents range from $380 to $480 per month. Wisconsin’s combination of affordable acquisition prices and consistent workforce housing demand makes it a solid addition to a diversified multi-state mobile home park portfolio.
What’s Driving Lot Rent Growth Across These Markets?
Three structural forces are driving mobile home park lot rent growth nationally — and particularly across the Southeast and Sun Belt:
- Affordable housing shortage: More than 20 million Americans spend over 30% of their income on housing. With single-family homes and apartment rents increasingly out of reach for working-class households, manufactured housing communities remain the lowest-cost unsubsidized housing option in most markets. That demand pressure is structural and persistent.
- Near-zero new supply: Only approximately 20 new manufactured housing communities are permitted nationally each year — roughly 0.04% of the existing stock of 45,000 communities. Zoning restrictions, NIMBY opposition, and entitlement complexity make new mobile home park development nearly impossible in most jurisdictions. This supply constraint gives existing park operators growing pricing power over time.
- Below-market rent gaps at existing communities: Many mobile home parks have been owned by the same family for decades and haven’t raised rents to market rates. Value-add operators who acquire these communities and systematically bring rents to market can see significant rent growth well above the baseline trend — often 15% to 40% over a 3-to-5-year hold period.
Understanding the distinction between market rent growth (what rising demand supports) and in-place rent growth (what a specific park has historically implemented) is essential when analyzing any mobile home park deal. A community with $350-per-month lot rents in a market where comparable parks charge $500 has 43% organic rent growth available — entirely independent of macroeconomic tailwinds.
How Lot Rent Growth Translates to Mobile Home Park Investment Value
The math is straightforward but powerful. Assume a mobile home park has 80 occupied lots at $450 per month in lot rent — generating $432,000 in annual gross revenue. Apply a 45% expense ratio and you have $237,600 in NOI. At a 7% cap rate, that’s approximately $3.4 million in value.
Now apply a 5% annual rent increase for three years. Lot rents move from $450 to $521 per month. Annual gross revenue grows to approximately $500,000. NOI rises to around $275,000. At the same 7% cap rate: approximately $3.93 million in value. That’s a $530,000 increase in asset value from lot rent growth alone — without adding a single new home or improving any infrastructure.
This is the compounding power behind mobile home park lot rent growth, and why tracking these state-level numbers matters for investors building a long-term portfolio thesis. For more context on the long-term performance trajectory, see our overview of mobile home park lot rent growth trends and projections through 2030.
Conclusion
Mobile home park lot rent growth is not uniform across the country — and understanding which states offer the strongest combination of current market rents, annual growth trajectory, and below-market opportunity is a critical input for any acquisition strategy. Florida leads on raw growth rate, but the broader Southeast (North Carolina, Tennessee, Georgia, South Carolina) offers an exceptional mix of population-driven demand, landlord-friendly regulation, and available deal flow. Midwest markets like South Dakota and Wisconsin offer higher cap rates and yield-focused returns for investors prioritizing current cash flow over long-term appreciation.
10 video modules, a 55-page master checklist, and 9 ready-to-use templates that walk you through every step of evaluating a mobile home park deal — from the first site visit to closing day.
Frequently Asked Questions
What is the average mobile home park lot rent in 2026?
The national average lot rent for a manufactured housing community is approximately $752 per month as of 2026, according to Berkadia’s Manufactured Housing Annual Report. Averages vary significantly by state and submarket — from under $400 per month in rural Midwest markets to over $900 per month in premium Sun Belt communities near high-growth metros.
How much do mobile home park lot rents increase each year?
Annual lot rent increases at well-operated mobile home parks typically range from 3% to 8%, depending on market conditions and the gap between current in-place rents and market rents. Florida’s most active submarkets are seeing increases of 8% to 11% annually. Midwest and Plains markets trend toward 3.5% to 4.5%, though communities with significant below-market rents can see larger increases when new operators acquire underperforming parks.
Which states have the highest mobile home park lot rent growth in 2026?
Florida leads with annual growth of 5.5% to 11% depending on submarket. North Carolina and South Carolina are averaging 5.5% to 6% annually. Tennessee and Georgia are close behind at approximately 5% to 5.5%. South Dakota and Wisconsin are growing at a more measured 3.8% to 4.8% annually.
How does lot rent growth affect a mobile home park’s value?
Mobile home parks are valued primarily using the income capitalization approach: NOI divided by cap rate. Every increase in annual NOI from lot rent growth translates directly to increased asset value. At a 7% cap rate, every $10,000 increase in annual NOI adds approximately $143,000 in property value — making consistent lot rent growth one of the most powerful value creation levers in the asset class.
What lot rent should I expect to charge in North Carolina or Tennessee in 2026?
In North Carolina, market lot rents for well-located communities range from $420 to $560 per month, with the high end in Charlotte and Raleigh submarkets. In Tennessee, current market rents run from $400 to $510 per month, with Nashville and Knoxville at the upper end. Operators currently charging significantly below these ranges have meaningful rent growth potential without capital improvements.
Get the top 20 lessons from two decades of mobile home park investing — free.