
If you’re evaluating whether now is the right time to invest in manufactured housing communities, the data has never been clearer. The 2025 Berkadia Manufactured Housing Annual Report — one of the most comprehensive institutional datasets covering this asset class — shows a market firing on all cylinders: transaction volume surged, occupancy hit near-record levels, and lot rents continued their steady climb. Here’s a breakdown of the key numbers, what they mean, and how to use this data to make smarter investment decisions.
Why Market Data Matters More Than Headlines
Manufactured housing has long been dismissed by mainstream real estate investors as a niche, illiquid, or socially complicated asset class. But institutional capital tells a different story. When the data shows a 47.1% year-over-year jump in transaction volume — with 460 communities changing hands in 2025 alone — that’s not a blip. That’s confirmation that sophisticated investors are quietly repositioning capital into one of the most structurally sound segments of the commercial real estate market.
Understanding mobile home park market data isn’t just useful for buying decisions. It shapes how you underwrite deals, how you evaluate operators, and how you think about holding periods. Whether you’re a passive investor considering a syndication or an active buyer sourcing off-market deals, these numbers are your compass.
Transaction Volume: The 47.1% Signal
Let’s start with the headline number. Manufactured housing community transaction volume increased 47.1% year-over-year in 2025, with 460 communities sold. That figure rivals some of the most active prior years in the asset class and reflects a dramatic rebound from the capital markets slowdown that squeezed deal flow in 2023–2024 due to elevated interest rates.
What’s driving this? A few forces are converging:
- Debt markets have normalized. Agency lenders (Fannie Mae and Freddie Mac) re-engaged more aggressively with manufactured housing in 2024–2025, lowering borrowing costs and enabling more trades to pencil.
- Seller motivation has increased. Many mom-and-pop operators who held through the rate spike are now transacting. Average seller age in this market skews older, and succession planning continues to drive off-market opportunities.
- Private equity appetite remains strong. As we covered in detail in our post on how private equity is changing the mobile home park market, institutional buyers have become a permanent fixture in this space — and their underwriting validates the asset class for everyone.
For buyers, higher transaction volume means more comp data, better price discovery, and a more liquid market than five years ago. For passive investors, it signals that exit opportunities on syndication investments should be more reliable as the cycle matures.
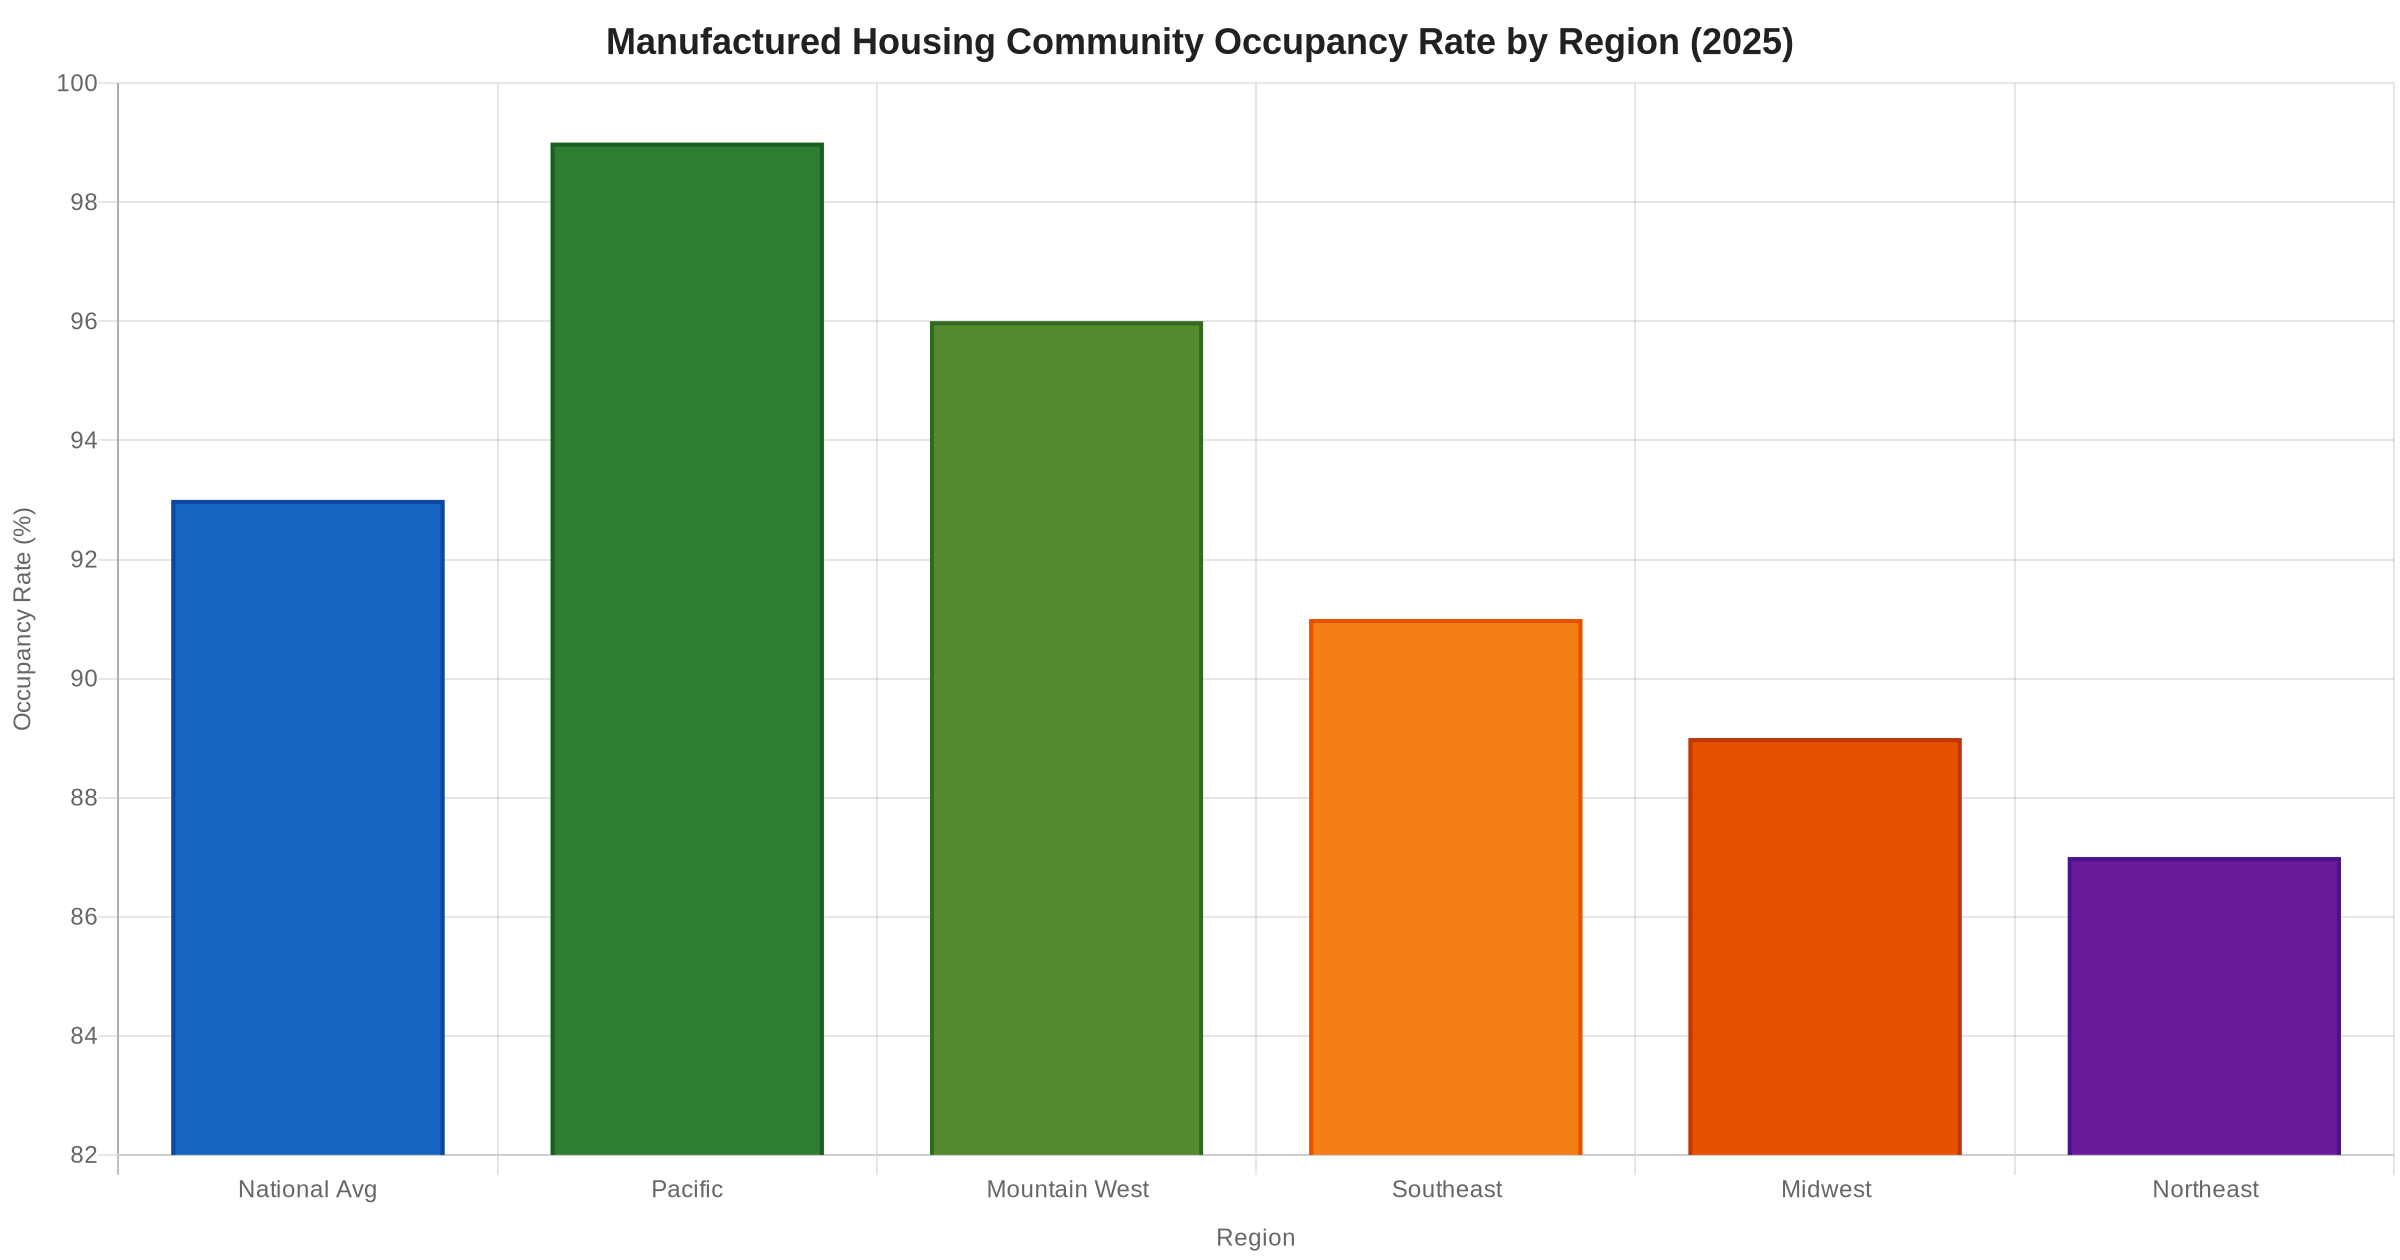
Occupancy: 93% Nationally — and What the Regional Gaps Mean
National occupancy across manufactured housing communities reached approximately 93% in 2025 — near the highest levels on record. The Pacific region led all markets at 99% occupancy, with Mountain West close behind at 96%. Even the lagging Northeast came in at 87%, which most multifamily operators would consider a very healthy baseline.
High occupancy isn’t just a vanity metric. For mobile home park investors, it translates directly to NOI stability. Unlike apartments where a landlord controls whether a unit is filled, manufactured housing community operators primarily rent land — and once a tenant-owned home is sited on a lot, the cost and friction of moving it means that tenant almost never leaves voluntarily. Industry data consistently shows annual home turnover rates of just 2–3%, compared to 40–50% for typical apartment complexes.
The geographic variation also matters for underwriting. Southeast markets — where Keel Team actively acquires — are running at approximately 91% occupancy. That still leaves meaningful value-add upside through infill: filling vacant lots with new or used homes. A community at 85% occupancy with city water and sewer in a strong MSA is often a more compelling deal than a 98% occupied park in a tertiary market. Occupancy data by region helps you benchmark what “good” actually looks like in your target geography.
For a deeper look at how to evaluate market conditions before buying, see our guide on the best markets for mobile home park investing in 2026.
Lot Rent Trends: Steady Growth With Room to Run
The Berkadia data points to a 2.2% compound annual growth rate (CAGR) in lot rents nationally over the trailing measurement period — with hotter markets running significantly higher. Florida, for instance, has seen lot rent growth in the 5.5–11% range annually as Sun Belt migration continues to outpace housing supply. Arizona and Colorado have posted similar gains.
The national average lot rent sits around $752 per month, up approximately 7% year-over-year in active markets. For context, that’s still a fraction of what it costs to rent a traditional apartment in most markets — which is precisely why demand has proven so durable even through interest rate cycles.
The affordability gap is structural. According to housing economists, more than 20 million Americans live in manufactured housing, and demand continues to grow as single-family home prices remain elevated. When ownership alternatives are priced out of reach for a large segment of the workforce, lot rent demand doesn’t soften — it entrenches.
This is why mobile home park NOI has been positive in every single year since 2007. Through the Global Financial Crisis, through COVID, through the 2022–2024 rate spike — the income stream held. That’s not luck. It’s structural.
Two decades of hard-won lessons distilled into one free guide. Whether you’re evaluating your first deal or your fiftieth, these insights will sharpen your approach.
Cap Rate Compression: What Buyers Are Paying in 2026
One of the most important signals in the Berkadia data for active buyers is cap rate compression. Premium manufactured housing communities — large, high-occupancy parks in primary and secondary markets with institutional-quality management — are trading at 4–5% cap rates. Stabilized Class B assets in growth markets are clearing at 5–7%. Value-add deals, particularly in the Southeast, can still be sourced in the 7–9% range.
This compression reflects the same dynamic playing out in multifamily over the past decade: institutional recognition drives capital inflows, which bids up prices, which compresses yields. The key difference is that manufactured housing has far less new supply entering the market to offset this compression. New manufactured housing communities represent roughly 0.04% of existing stock annually — versus 3–4% for apartments. That supply constraint means cap rate compression in mobile home parks is more durable than in other asset classes.
For investors evaluating deals today, the implication is clear: chasing yield in oversaturated primary markets is difficult. The opportunity lives in secondary and tertiary markets — where operator expertise, community relationships, and willingness to do the operational work create a moat that institutional buyers can’t easily replicate.
For a primer on how to interpret cap rates in your underwriting, read our full breakdown: Mobile Home Park Cap Rates Explained: What’s a Good Cap Rate in 2026?
What the 2026 Data Tells Active and Passive Investors
Reading market data correctly means translating aggregate numbers into specific decisions. Here’s how to apply the Berkadia figures across different investor profiles:
For Active Buyers (Owner-Operators)
The transaction volume surge means more competition for quality assets — but also more comps to anchor your underwriting. Focus your acquisition criteria on markets where occupancy is below the regional average (value-add opportunity) but economic fundamentals (population growth, job base, median income) are strong. Use lot rent growth trends to stress-test your rent bump assumptions.
For Passive Investors (LPs in Syndications)
Strong occupancy and rising lot rents are positive signals for the funds and syndications you may be evaluating. But the macro data doesn’t substitute for deal-level diligence. Ask operators specifically what their in-place occupancy rate is relative to regional benchmarks, and what their value-add thesis is for any vacancy gap. The best operators will have a specific plan — not just a market tailwind.
For Investors Considering Timing
Market data doesn’t tell you “buy now” or “wait.” It tells you the long-term structural picture. And that picture has been consistent for 20+ years: undersupplied, high-demand, stable-income asset class with low tenant turnover and strong NOI durability. Anyone who has waited for the “perfect time” to enter manufactured housing has consistently underperformed those who entered at reasonable valuations and held through cycles.
For more on the investment fundamentals, read our comprehensive analysis: Are Mobile Home Parks a Good Investment in 2026?
Conclusion: Data-Driven Confidence in a Resilient Asset Class
The 2025 Berkadia data tells a consistent story: manufactured housing communities are operating at near-peak occupancy, transaction volume has recovered sharply, and lot rents continue their steady march higher. The structural tailwinds — housing affordability pressure, limited new supply, and sticky tenancy — aren’t going away.
For investors who have been watching from the sidelines, the data provides a foundation for conviction. For those already in the asset class, it validates the thesis. Either way, the numbers deserve careful attention — and the operators who understand them deeply tend to be the ones generating the best long-term results.
10 video modules, a 55-page master checklist, and 9 ready-to-use templates that walk you through every step of evaluating a mobile home park deal — from the first site visit to closing day.
Frequently Asked Questions
What is the current national occupancy rate for manufactured housing communities?
According to 2025 industry data from Berkadia, the national average occupancy rate for manufactured housing communities is approximately 93%. Regional rates vary, with Pacific markets leading at 99% and the Northeast at around 87%.
How much did mobile home park transaction volume grow in 2025?
Transaction volume in the manufactured housing community sector increased 47.1% year-over-year in 2025, with 460 communities changing hands. This represents one of the strongest years of deal activity on record for the asset class.
What is the average lot rent in a mobile home park in 2025?
The national average lot rent is approximately $752 per month, with year-over-year growth in active markets running around 7%. High-demand Sun Belt markets like Florida and Arizona have seen annual lot rent increases of 5.5–11%.
What cap rate should I expect when buying a mobile home park in 2026?
Cap rates vary widely based on asset quality and location. Premium, institutional-quality communities trade at 4–5%. Stabilized Class B parks in growth markets are in the 5–7% range. Value-add opportunities, particularly in the Southeast, can still be found in the 7–9% range for investors willing to do the operational work.
Why has mobile home park NOI been positive every year since 2007?
Several structural factors contribute to the consistent NOI resilience of manufactured housing: tenant-owned homes are expensive to move (creating extremely low turnover), the asset class serves essential affordable housing demand that doesn’t disappear during downturns, new supply is virtually zero, and lot rents are low enough relative to alternatives that tenants are highly motivated to stay current on payments.
Get the top 20 lessons from two decades of mobile home park investing — free.