Numbers don’t lie — and in manufactured housing, the numbers tell a compelling story. With over 43,000 communities across the United States and roughly 22 million residents calling manufactured homes home, this is one of the largest and most overlooked affordable housing asset classes in the country. Yet most investors still don’t have a clear picture of the industry’s scale, trajectory, or investment fundamentals.
This page pulls together the most important manufactured housing industry statistics for 2026 — shipment volumes, occupancy rates, lot rents, transaction data, and cap rate benchmarks — in one place. These numbers matter whether you’re evaluating your first deal or your fiftieth.
How Many Manufactured Housing Communities Exist in the United States?
Estimates vary by source, but the most widely cited figure puts the number of manufactured housing communities in the U.S. at approximately 43,000 to 45,000 communities, containing roughly 3.5 to 4 million lots. The U.S. Census Bureau estimates that over 22 million Americans live in manufactured homes — roughly 6.5% of the total U.S. housing stock.
What makes this particularly relevant for investors: new supply is essentially frozen. Zoning restrictions, community opposition, and permitting barriers mean fewer than 20 to 25 new manufactured housing communities are permitted nationally each year. That is less than 0.05% of existing stock. No other major real estate asset class carries a supply constraint this structural or this durable.
HUD Code Manufactured Home Shipments: 2019 Through 2025
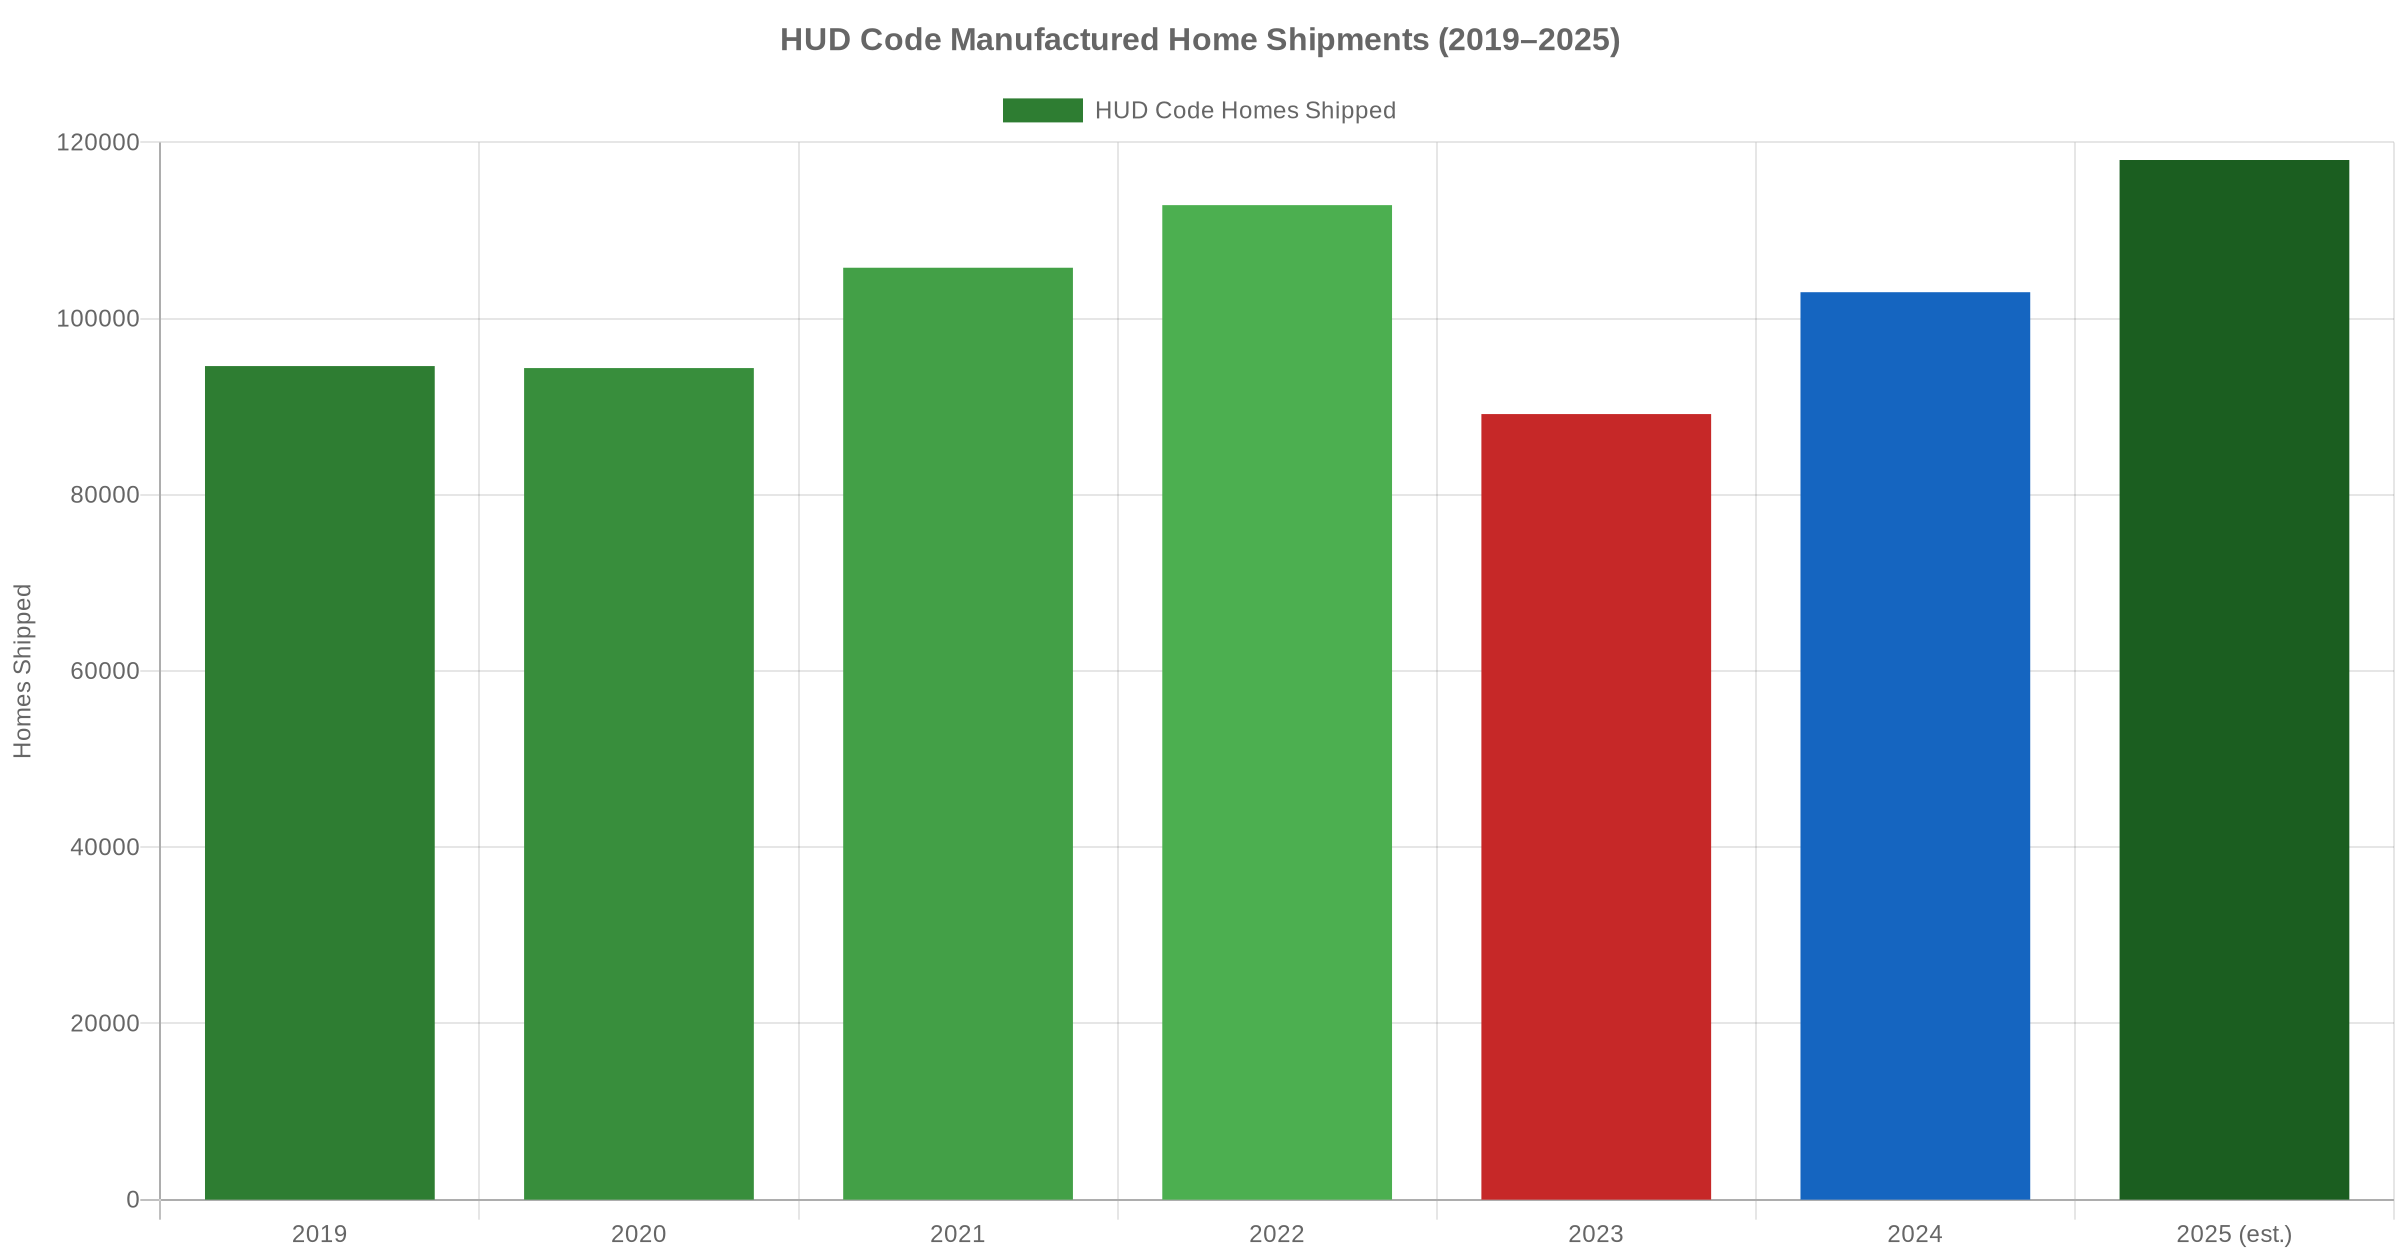
One of the clearest indicators of manufactured housing demand is annual HUD code shipment volume — the number of new manufactured homes shipped from factories to communities and private land each year. The chart below shows the trend from 2019 through estimated 2025:
Key takeaways from the shipment trend:
- 2022 was the peak at approximately 112,882 homes shipped — the highest annual volume since the early 2000s.
- 2023 saw a pullback to roughly 89,169 homes, driven primarily by rising chattel loan interest rates that compressed home-only financing demand inside communities.
- 2024 and 2025 are recovering strongly, with 2025 estimated to top 118,000 shipments as rate stabilization and persistent affordability pressures redirect more households toward manufactured housing.
For mobile home park investors, rising shipment volumes signal increasing availability of new homes for infill value-add strategies. Operators who can source homes and fill vacant lots during a recovery cycle often see the most significant near-term NOI jumps. For more on how financing intersects with this dynamic, see our Mobile Home Park Financing Guide 2026.
National Occupancy Rates in Manufactured Housing Communities
Occupancy is the heartbeat of a manufactured housing community’s cash flow. National data from Berkadia’s 2025 Manufactured Housing Annual Report puts the overall U.S. occupancy rate at approximately 93 to 94 percent — up from roughly 86.5% a decade ago.
Regional breakdowns reveal significant variation:
- Pacific region: approximately 99% occupancy — effectively no vacancy
- Southeast (NC, TN, GA, SC): 90 to 95% range, with strong upward trajectory tied to population migration into these markets
- Midwest: 88 to 93%, recovering steadily from prior-decade underperformance
- Northeast: 91 to 95%, constrained by land costs and limited new community development
These occupancy rates are structurally supported by a simple dynamic: when a manufactured home resident moves a home out of a community, it typically takes months and significant personal expense. Most residents simply stay. Annual home turnover in manufactured housing communities runs approximately 2.2%, compared to 47% annually in apartments — a difference that creates dramatically more predictable revenue for operators and passive investors alike.
Average Lot Rent: National and Regional Benchmarks
Lot rent — the monthly fee residents pay to occupy a space in a community — is the primary revenue driver in manufactured housing investing. According to 2025 data from Berkadia and CBRE:
- National average lot rent: $752 per month
- Annual lot rent growth nationally: approximately 4.5 to 6% per year
- High-growth markets: Florida (5.5 to 11% annually), Arizona (plus 9.8% in 2025), Colorado (plus 12.1% in 2025)
- Southeast target markets: North Carolina plus 5.8%, South Carolina plus 6.1%, Georgia plus 5.5%, Tennessee plus 5.2%
At a $752 per month national average, manufactured housing communities remain dramatically more affordable than apartments (national average approximately $1,740 per month) or single-family rentals (national average approximately $2,100 per month). This affordability gap is the structural demand driver that underpins occupancy stability — and it is widening, not narrowing, as site-built construction costs remain elevated entering 2026.
Two decades of hard-won lessons distilled into one free guide. Whether you’re evaluating your first deal or your fiftieth, these insights will sharpen your approach.
Transaction Volume and Institutional Activity in 2025
Manufactured housing as an investment category has attracted significant institutional attention over the past five years. Key transaction data points from Berkadia and CBRE for 2025:
- Total transaction volume: approximately $3.2 billion in manufactured housing community sales
- Year-over-year growth: plus 47.1% versus 2024 — the largest single-year transaction volume increase in recent history
- Number of communities sold: approximately 460 in 2025
- Institutional share of purchases: approximately 23%, up from 13% in 2017
Private equity firms — including Apollo through Inspire Communities, the Carlyle Group, and various real estate private equity funds — have materially increased their manufactured housing community acquisitions. Sun Communities and Equity LifeStyle Properties remain the largest publicly traded owners, with Sun controlling approximately 185,000 lots and Equity LifeStyle approximately 170,000 lots across their respective portfolios.
For individual and middle-market operators, the strategic sweet spot remains communities in the 50 to 150 lot range — too small to attract meaningful institutional competition, but large enough to justify professional management. This is where Keel Team has focused acquisitions across North Carolina, Tennessee, Georgia, and South Carolina.
Cap Rates and Return Benchmarks for 2026
Cap rates have compressed significantly as institutional capital has entered the space. Current benchmarks from CBRE and Berkadia show a wide range depending on asset quality and market:
- Premium stabilized communities (institutional quality, city utilities, 90%+ occupancy, strong market rents): 4.5 to 5.5%
- Middle-market stabilized communities: 5.5 to 7.5%
- Value-add opportunities (below-market rents, occupancy upside, deferred capital): 7 to 12% going-in cap rates
Compared to apartments (national average approximately 5.2% cap rate in 2026) and single-family rentals (approximately 4.8%), the manufactured housing value-add segment continues to offer superior yield potential — with lower vacancy risk, structurally lower tenant turnover, and a supply moat that sustained institutional capital flows cannot easily overcome. For a detailed state-level breakdown, see our post on Mobile Home Park Cap Rates by State in 2026.
The Top Manufactured Housing Community Owners in 2026
Understanding who owns what helps investors identify where competition is most intense and where independent operators retain a meaningful edge:
- Sun Communities (SUI): approximately 185,000 lots across 288 or more communities in the U.S. and Canada
- Equity LifeStyle Properties (ELS): approximately 170,000 lots across 450 or more communities
- Hometown America: approximately 60,000 or more lots
- Inspire Communities (Apollo): approximately 60,000 or more lots across multiple brand portfolios
- Yes! Communities: approximately 47,000 lots across 19 states
Combined, the top 10 institutional owners control roughly 600,000 to 700,000 lots — approximately 17 to 20% of total U.S. supply. The remaining 80% of communities are owned by individual owners, family operators, and smaller regional groups. This high degree of fragmentation is precisely what makes off-market, direct-to-owner deal sourcing viable for operators with relationships and local knowledge in target markets.
The Affordability Driver Behind Every Data Point
No statistic matters more to the long-term outlook for manufactured housing than the price differential: the median price of a new manufactured home in 2025 is approximately $138,000, compared to $435,000 or more for a new site-built home. Even accounting for recent tariff-driven cost increases on steel and aluminum inputs, manufactured housing remains the most accessible path to homeownership for millions of American households.
With mortgage rates elevated and site-built construction starts constrained by labor costs and materials pricing, the affordability gap between manufactured and site-built housing is widening. That structural demand dynamic underpins occupancy stability in existing communities regardless of broader economic conditions. For a deeper look at how the manufactured housing market is evolving, see our analysis of Mobile Home Park Market Data 2026.
What the Data Tells Investors
The 2026 manufactured housing industry data picture is consistent across sources: demand is rising, new supply is structurally constrained, occupancy is at near-record levels nationally, and institutional capital is flowing in at an accelerating pace. For middle-market operators and passive investors targeting the 50 to 150 lot community range in high-growth Southeast markets, the opportunity window remains open — but it will not stay that way indefinitely as cap rate compression works its way through the value-add segment of the market.
The investors who succeed here are the ones who understand the data deeply, underwrite conservatively, and operate communities with the professionalism that drives long-term tenant retention. The statistics support the thesis. Execution determines the outcome.
Frequently Asked Questions About the Manufactured Housing Industry
How many manufactured housing communities are there in the U.S.?
Approximately 43,000 to 45,000 manufactured housing communities exist in the United States, containing an estimated 3.5 to 4 million lots. The total count has declined modestly over several decades as some communities have closed or been redeveloped, while new community entitlements remain minimal due to zoning barriers and community opposition.
What is the average lot rent in a manufactured housing community in 2026?
The national average lot rent reached approximately $752 per month in 2025, according to Berkadia’s Manufactured Housing Annual Report. Lot rents vary significantly by region — from under $400 per month in parts of the rural Midwest to over $1,200 per month in high-cost coastal markets in California and Florida.
How many manufactured homes are shipped each year in the U.S.?
Annual HUD code shipment volumes peaked at approximately 112,882 homes in 2022, declined to roughly 89,169 in 2023 as financing conditions tightened, and are estimated to recover to approximately 118,000 in 2025 as affordability pressures renew demand for factory-built housing options.
What is the occupancy rate for manufactured housing communities nationally?
National occupancy rates for manufactured housing communities averaged approximately 93 to 94% in 2025, with the Pacific region approaching 99%. This compares favorably to the multifamily apartment sector, which averaged approximately 93 to 94% nationally but carries annual resident turnover rates exceeding 45% versus approximately 2.2% for manufactured housing communities.
What cap rates are manufactured housing communities trading at in 2026?
Cap rates range widely by asset quality and market. Institutional-grade stabilized communities are trading at 4.5 to 5.5%. Stabilized middle-market communities trade at 5.5 to 7.5%. Value-add opportunities with occupancy or rent-to-market upside typically show 7 to 12% going-in cap rates. Institutional capital compression has pushed premium asset pricing up significantly over the past five years.
10 video modules, a 55-page master checklist, and 9 ready-to-use templates that walk you through every step of evaluating a mobile home park deal — from the first site visit to closing day.
Get the top 20 lessons from two decades of mobile home park investing — free.