Ask any experienced mobile home park investor what the single most important number in a deal is, and most will say the same thing: the cap rate. It shapes your purchase price, your return expectations, and your exit strategy all at once.
But “what cap rate should I expect?” is a question that cannot be answered in a vacuum. In 2026, mobile home parks are trading across a surprisingly wide band — from 4.0% for top-tier institutional assets to 10% or more in rural tertiary markets. Knowing which tier you are shopping in changes everything about how you underwrite a deal.
This guide breaks down mobile home park cap rates by market tier for 2026, explains what drives the differences, and gives you a practical framework for applying this data when you are analyzing a deal.
What Is a Cap Rate — and Why It Matters for Mobile Home Park Investors
A cap rate (capitalization rate) is the ratio of a property’s annual net operating income (NOI) to its purchase price. If a mobile home park generates $100,000 in NOI and sells for $1,250,000, the cap rate is 8.0%.
Cap Rate = NOI ÷ Purchase Price
A lower cap rate means buyers are paying more for each dollar of income — typically because they believe that income is stable, growing, or both. A higher cap rate means buyers are taking on more risk or uncertainty, and they want compensation for it.
For mobile home parks specifically, cap rate benchmarks have compressed significantly over the past decade as institutional capital has entered the asset class. Communities that traded at 8–10% a decade ago now trade at 5–7% in most markets — and even lower for the best assets in the best locations. For a foundational primer, see our guide on Mobile Home Park Cap Rates Explained: What’s a Good Cap Rate in 2026?
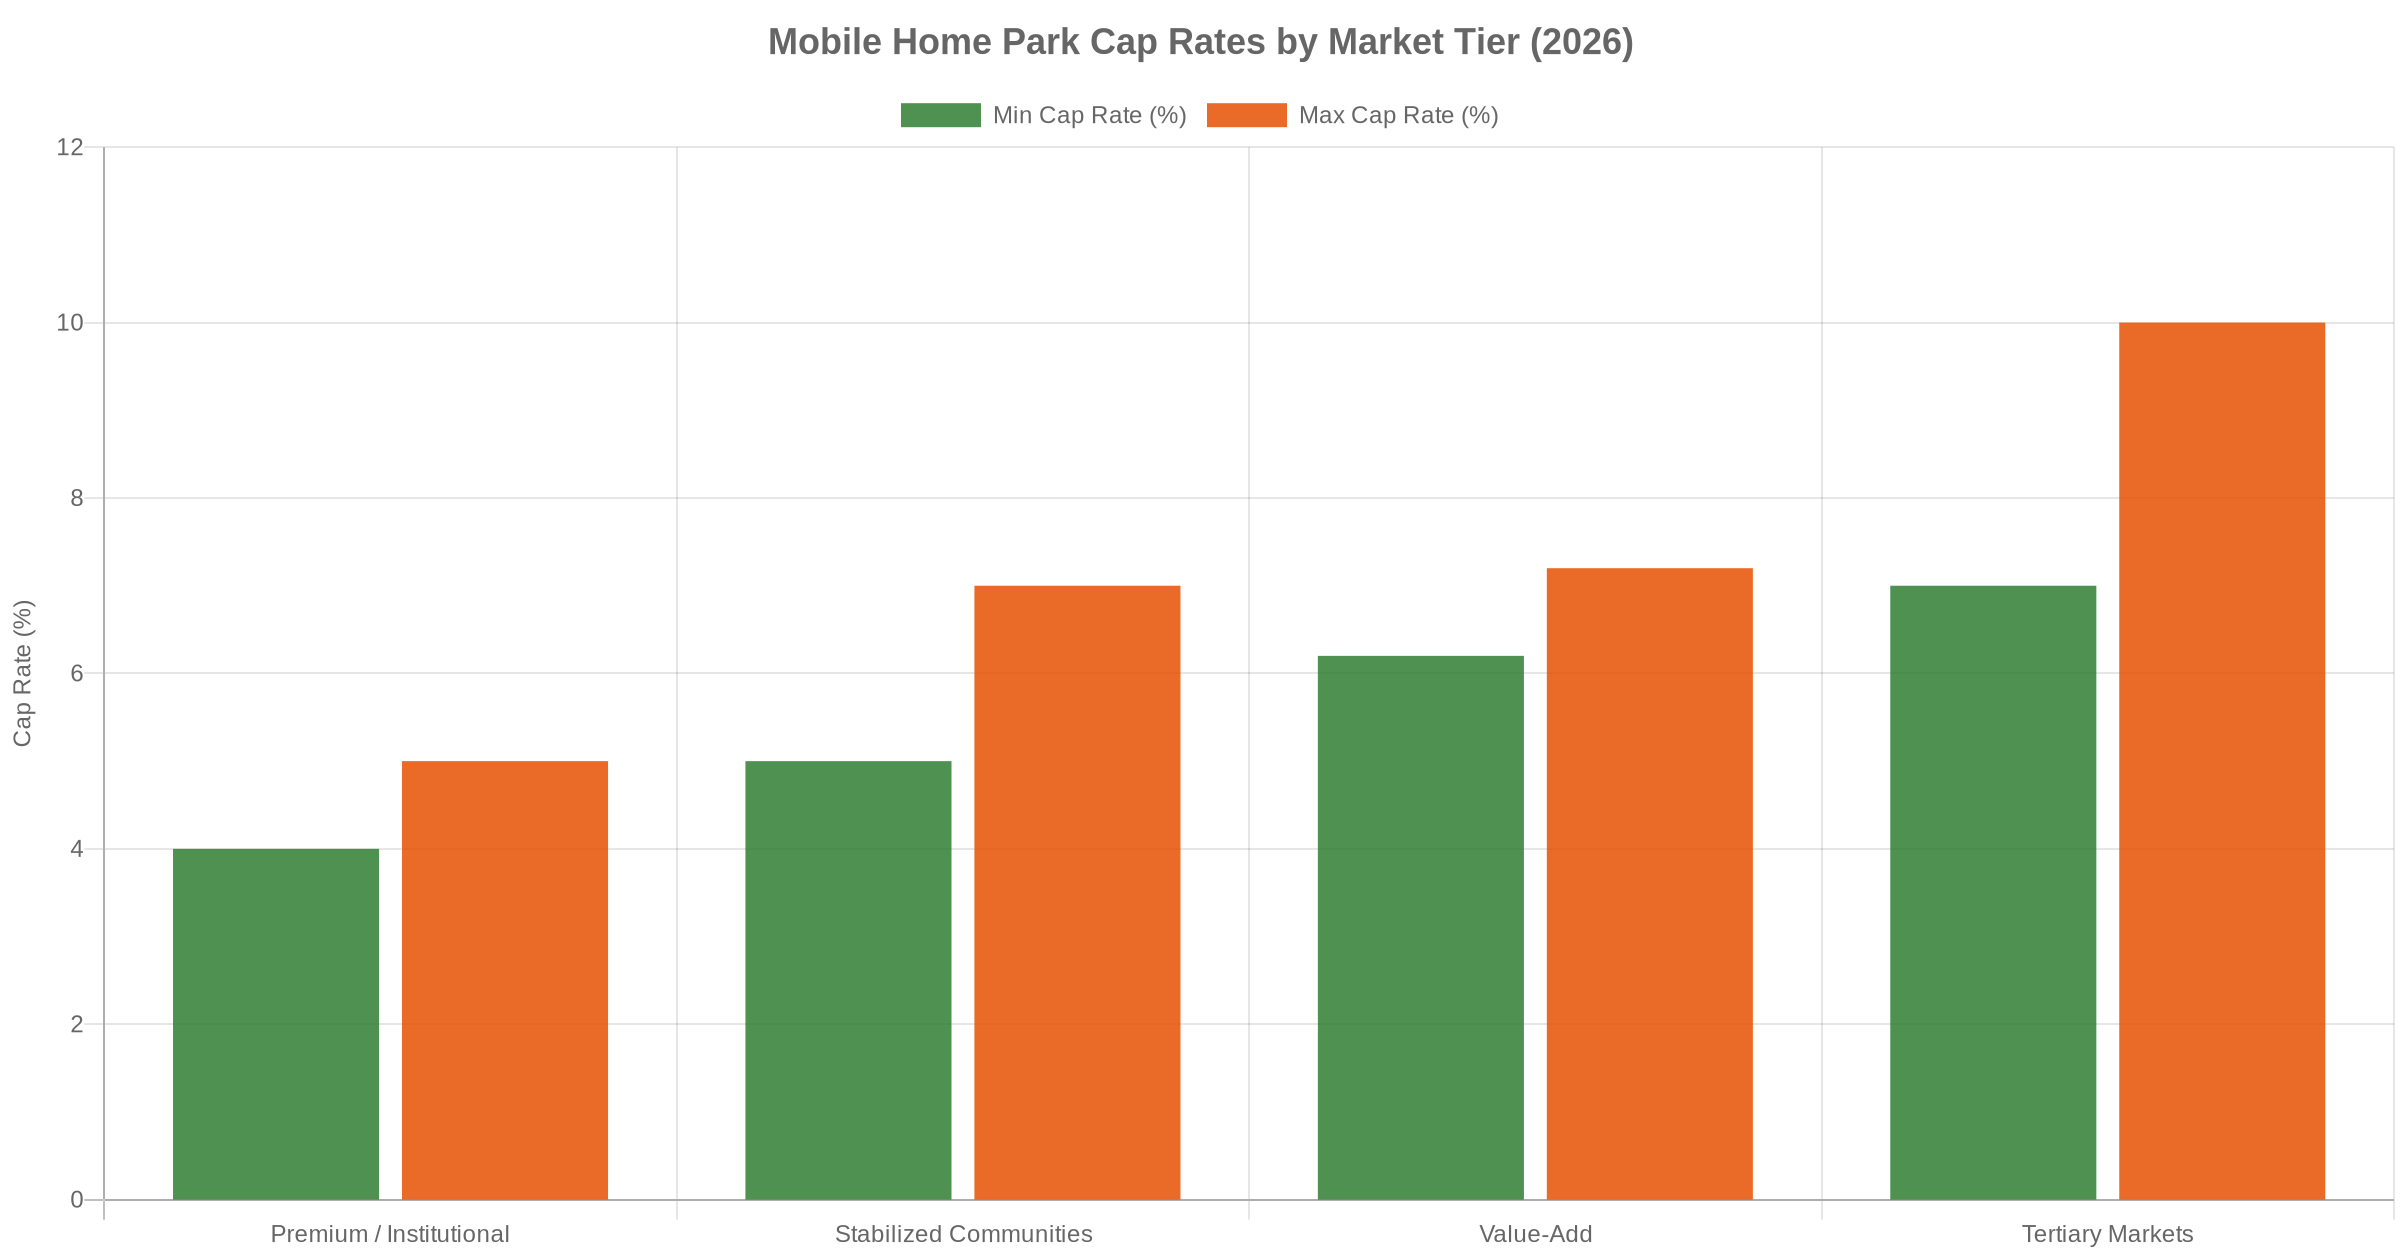
Mobile Home Park Cap Rates by Market Tier in 2026
Not all mobile home parks are created equal. Cap rates vary dramatically based on asset quality, location, utility structure, occupancy, and the depth of the buyer pool. Here is how the market breaks down by tier.
Tier 1 — Premium / Institutional-Grade Communities (4.0%–5.0%)
The most competitive segment of the market today is large, well-located communities with city water and sewer, high occupancy (90%+), market-rate lot rents, a strong tenant-owned home ratio, and clean infrastructure. These are the communities that REITs like Equity LifeStyle Properties and Sun Communities are competing to acquire.
In 2026, premium mobile home parks in high-demand Sun Belt and coastal MSAs are trading at 4.0% to 5.0% cap rates. Deals in the low-4% range have been documented in markets like Phoenix, Raleigh, and Charlotte where institutional demand is most intense. At these cap rates, buyers are pricing in continued lot rent growth and long hold periods — not current yield.
For most independent operators and syndicators, Tier 1 deals are out of reach on price alone. The buyer pool is dominated by publicly traded REITs and well-capitalized private equity firms with a cost of capital that individual investors cannot match.
Tier 2 — Stabilized Communities (5.0%–7.0%)
The stabilized tier covers solid, cash-flowing mobile home parks that do not quite reach institutional grade — perhaps because they are slightly smaller (50–150 lots), located in secondary markets, or carry minor deferred maintenance. These are the deals that most regional syndicators and experienced operators target.
In 2026, stabilized communities are broadly trading at 5.0% to 7.0% cap rates, with the wide range reflecting real diversity within the tier. A 120-lot park with city utilities in the Charlotte suburbs might trade at 5.5%. A 75-lot park in a Tennessee secondary market with the same fundamentals might clear at 6.5–7.0%.
This is where most of the actionable deal flow exists for operators not competing directly with institutional capital. The underwriting is straightforward, lender appetite is strong, and exit liquidity is reasonable.
Tier 3 — Value-Add Opportunities (6.2%–7.2%)
Value-add mobile home parks typically have one or more of the following: below-market lot rents, meaningful vacancy, park-owned homes that can be converted to tenant-owned, deferred infrastructure investment, or a self-managing seller without professional systems. The story is not what the community earns today — it is what it can earn in 24–36 months.
These deals often trade at 6.2% to 7.2% cap rates on current income, which understates the true opportunity. Skilled operators underwrite to a stabilized cap rate and work backward to determine maximum purchase price. If a value-add park trades at 7.0% today but stabilizes at 9.0%+ on improved NOI, that is significant upside — particularly when you exit at a 6.0% stabilized cap.
Value-add deals require more operational involvement and carry more execution risk than stabilized acquisitions, but they also offer the highest return potential in the current environment for operators with genuine hands-on capability.
Tier 4 — Tertiary Markets (7.0%–10.0%+)
Rural and tertiary-market mobile home parks — those in small towns far from major MSAs, with well or septic utilities, or low lot density — trade at significantly higher cap rates because the buyer pool is thinner and the risk profile is elevated.
Cap rates in the 7–10%+ range are still achievable in rural markets, particularly in states like South Dakota, Wisconsin, and parts of Appalachia. The higher yield compensates for harder-to-finance assets (many lenders avoid well and septic), lower lot rent growth potential, and more limited exit liquidity.
For investors who understand these markets and have local operational capacity, tertiary-market deals can deliver strong cash-on-cash returns. But they are not appropriate for investors expecting institutional-style exit liquidity. See our full state-by-state breakdown: Mobile Home Park Cap Rates by State in 2026: NC, TN, GA, SC, and SD Breakdown.
What Drives Cap Rate Differences Within Each Tier
Within any given tier, cap rates are not uniform. Several factors push a deal toward the top or bottom of its range:
- Utility type: City water and city sewer commands a meaningful premium over well and septic. Lenders prefer it, buyers pay more for it, and it eliminates the largest operational risk category in the asset class.
- Occupancy rate: Parks at 90%+ occupancy trade tighter than 70–80% occupied communities. Every vacant lot represents uncertain future income — buyers discount it heavily in cap rate pricing.
- Tenant-owned vs. park-owned home ratio: Tenant-owned home-heavy parks trade at lower cap rates because operational complexity and turnover costs are dramatically lower. Park-owned homes introduce maintenance, management, and vacancy risk that buyers price in.
- In-place lot rent vs. market rent: Parks with meaningful below-market lot rents can trade at slightly higher cap rates — the gap represents upside, but buyers do not pay full credit until that upside is actually realized.
- Community size: Larger parks (150+ lots) tend to trade tighter than smaller ones because they attract more institutional buyer competition from investors who need to deploy significant capital per transaction.
Two decades of hard-won lessons distilled into one free guide. Whether you’re evaluating your first deal or your fiftieth, these insights will sharpen your approach.
Geographic Variation: How Location Affects Mobile Home Park Cap Rates
Geography plays a major role in where any given deal falls within its tier’s range. Southeast markets — the Carolinas, Tennessee, Georgia — have historically offered better risk-adjusted cap rates than coastal markets while still delivering strong population growth and lot rent appreciation potential.
Pacific Coast markets (California, Washington, Oregon) have seen cap rates compress to some of the lowest in the country — sometimes below 4.5% for premium communities — driven by extreme housing affordability pressure and constrained supply. Buying in these markets requires a very long investment horizon to generate acceptable returns.
In the Midwest and Great Plains, cap rates tend to run higher for equivalent assets due to thinner institutional buyer competition and more modest population growth. South Dakota and Wisconsin, two of Keel Team’s target acquisition states, regularly surface stabilized deals in the 7.5–10.5% range that would trade at 5–6% in North Carolina.
Understanding geographic context matters because cap rates are not just about risk — they reflect the depth of the buyer market. In less competitive markets, the same operational skill can generate significantly higher returns for patient operators with local expertise.
How to Apply Cap Rate Benchmarks in Your Underwriting
Knowing these benchmarks is only useful if you apply them correctly. Here is how experienced operators use cap rate tiers in practice:
- Identify the tier first. Before running any numbers, determine which tier the park belongs in based on its location, utility type, occupancy, and operational profile. This tells you the cap rate range comparable buyers will apply — which becomes your ceiling for purchase price.
- Underwrite to a stabilized cap rate. For value-add deals especially, do not let the seller’s current cap rate drive your offer. Calculate what stabilized NOI looks like post-improvements, then determine value at your target exit cap rate. Work backward from the exit to your acquisition price.
- Build in margin of safety on cap rate movement. If you are buying at 6.5% and plan to sell at 6.0%, that is a compressed exit with limited cushion. Experienced investors build cap rate expansion risk into their underwriting — if rates move 50–75 basis points during your hold, can you still hit your return targets?
- Pair cap rate with your financing structure. A deal that makes sense at a 6.5% cap with 5.5% debt looks very different with 7.0% debt. Review our Mobile Home Park Financing Guide 2026 for current loan options, LTV ranges, and how to match the right debt structure to your asset tier.
Conclusion
Mobile home park cap rates in 2026 span a wide band — from 4.0% at the institutional-grade top to 10%+ in tertiary rural markets. The key is knowing which tier you are evaluating, understanding what drives variation within that tier, and applying these benchmarks to your underwriting rather than relying on seller pro formas or rule-of-thumb assumptions.
For most private operators and syndicators, the most actionable opportunities sit in the stabilized and value-add tiers: 5.0–7.2% going-in cap rates on fundamentally sound communities with room to grow net operating income. That is where disciplined underwriting, operational skill, and strong lender relationships translate directly into superior long-term investor returns.
10 video modules, a 55-page master checklist, and 9 ready-to-use templates that walk you through every step of evaluating a mobile home park deal — from the first site visit to closing day.
Frequently Asked Questions About Mobile Home Park Cap Rates in 2026
What is a good cap rate for a mobile home park in 2026?
A “good” cap rate depends on your strategy and market. For stabilized, city-utility communities in secondary markets, a cap rate of 5.5–7.0% is reasonable. For value-add deals with meaningful upside, look for 6.5–8.0% on current income. Premium institutional-grade communities typically trade at 4.0–5.0%.
Why are some mobile home parks trading at 4% cap rates?
The lowest cap rates reflect premium communities — large, fully occupied, city utilities, majority tenant-owned homes, in high-growth MSAs — where REITs and private equity firms are competing aggressively. At these cap rates, buyers are banking on continued lot rent growth and long-term appreciation rather than immediate cash yield.
How does cap rate relate to total investment return?
Cap rate measures return on an unlevered, all-cash basis. Your actual cash-on-cash return depends on how much debt you use and at what interest rate. A 6.5% cap rate deal financed with 65% LTV debt at 6.25% creates modest positive leverage; equity investors earn slightly more than the going-in cap. At today’s rates, debt structuring is critical to generating acceptable levered returns.
What is the difference between a going-in cap rate and an exit cap rate?
The going-in cap rate is the cap rate at acquisition based on current NOI. The exit cap rate is the rate applied to projected stabilized NOI when you sell at the end of the hold period. If you buy at a 7.0% going-in cap, improve NOI significantly, and sell at a 6.0% exit cap, you capture both ongoing cash flow during the hold and meaningful appreciation at exit — the combination that drives strong equity multiples in value-add mobile home park investing.
Do mobile home park cap rates vary significantly by state?
Yes — materially. Southeast states (NC, TN, GA, SC) tend to offer better cap rates than West Coast or Northeast markets for equivalent asset quality, while Midwest and Plains states (SD, WI) offer even higher cap rates with thinner institutional competition. See our full analysis: Mobile Home Park Cap Rates by State in 2026.
Get the top 20 lessons from two decades of mobile home park investing — free.