Understanding mobile home park cash flow is one of the first things any serious investor needs to nail down before writing a check. Unlike other commercial real estate, mobile home parks have a unique income and expense structure that can produce surprisingly strong returns — once you know how the math works.
This guide breaks down exactly how cash flow is generated in a mobile home park investment, from gross rent income all the way down to the money that actually hits your bank account each month.
Step 1: Start With Gross Rental Income
In a mobile home park, the primary revenue source is lot rent — the monthly fee tenants pay to place their home on your land. The tenant typically owns their own manufactured home; you own the dirt and the infrastructure.
This distinction matters enormously for cash flow. Because tenants own their homes, you are not responsible for interior maintenance or home-level repairs. This keeps operating expenses dramatically lower than multifamily or single-family rentals.
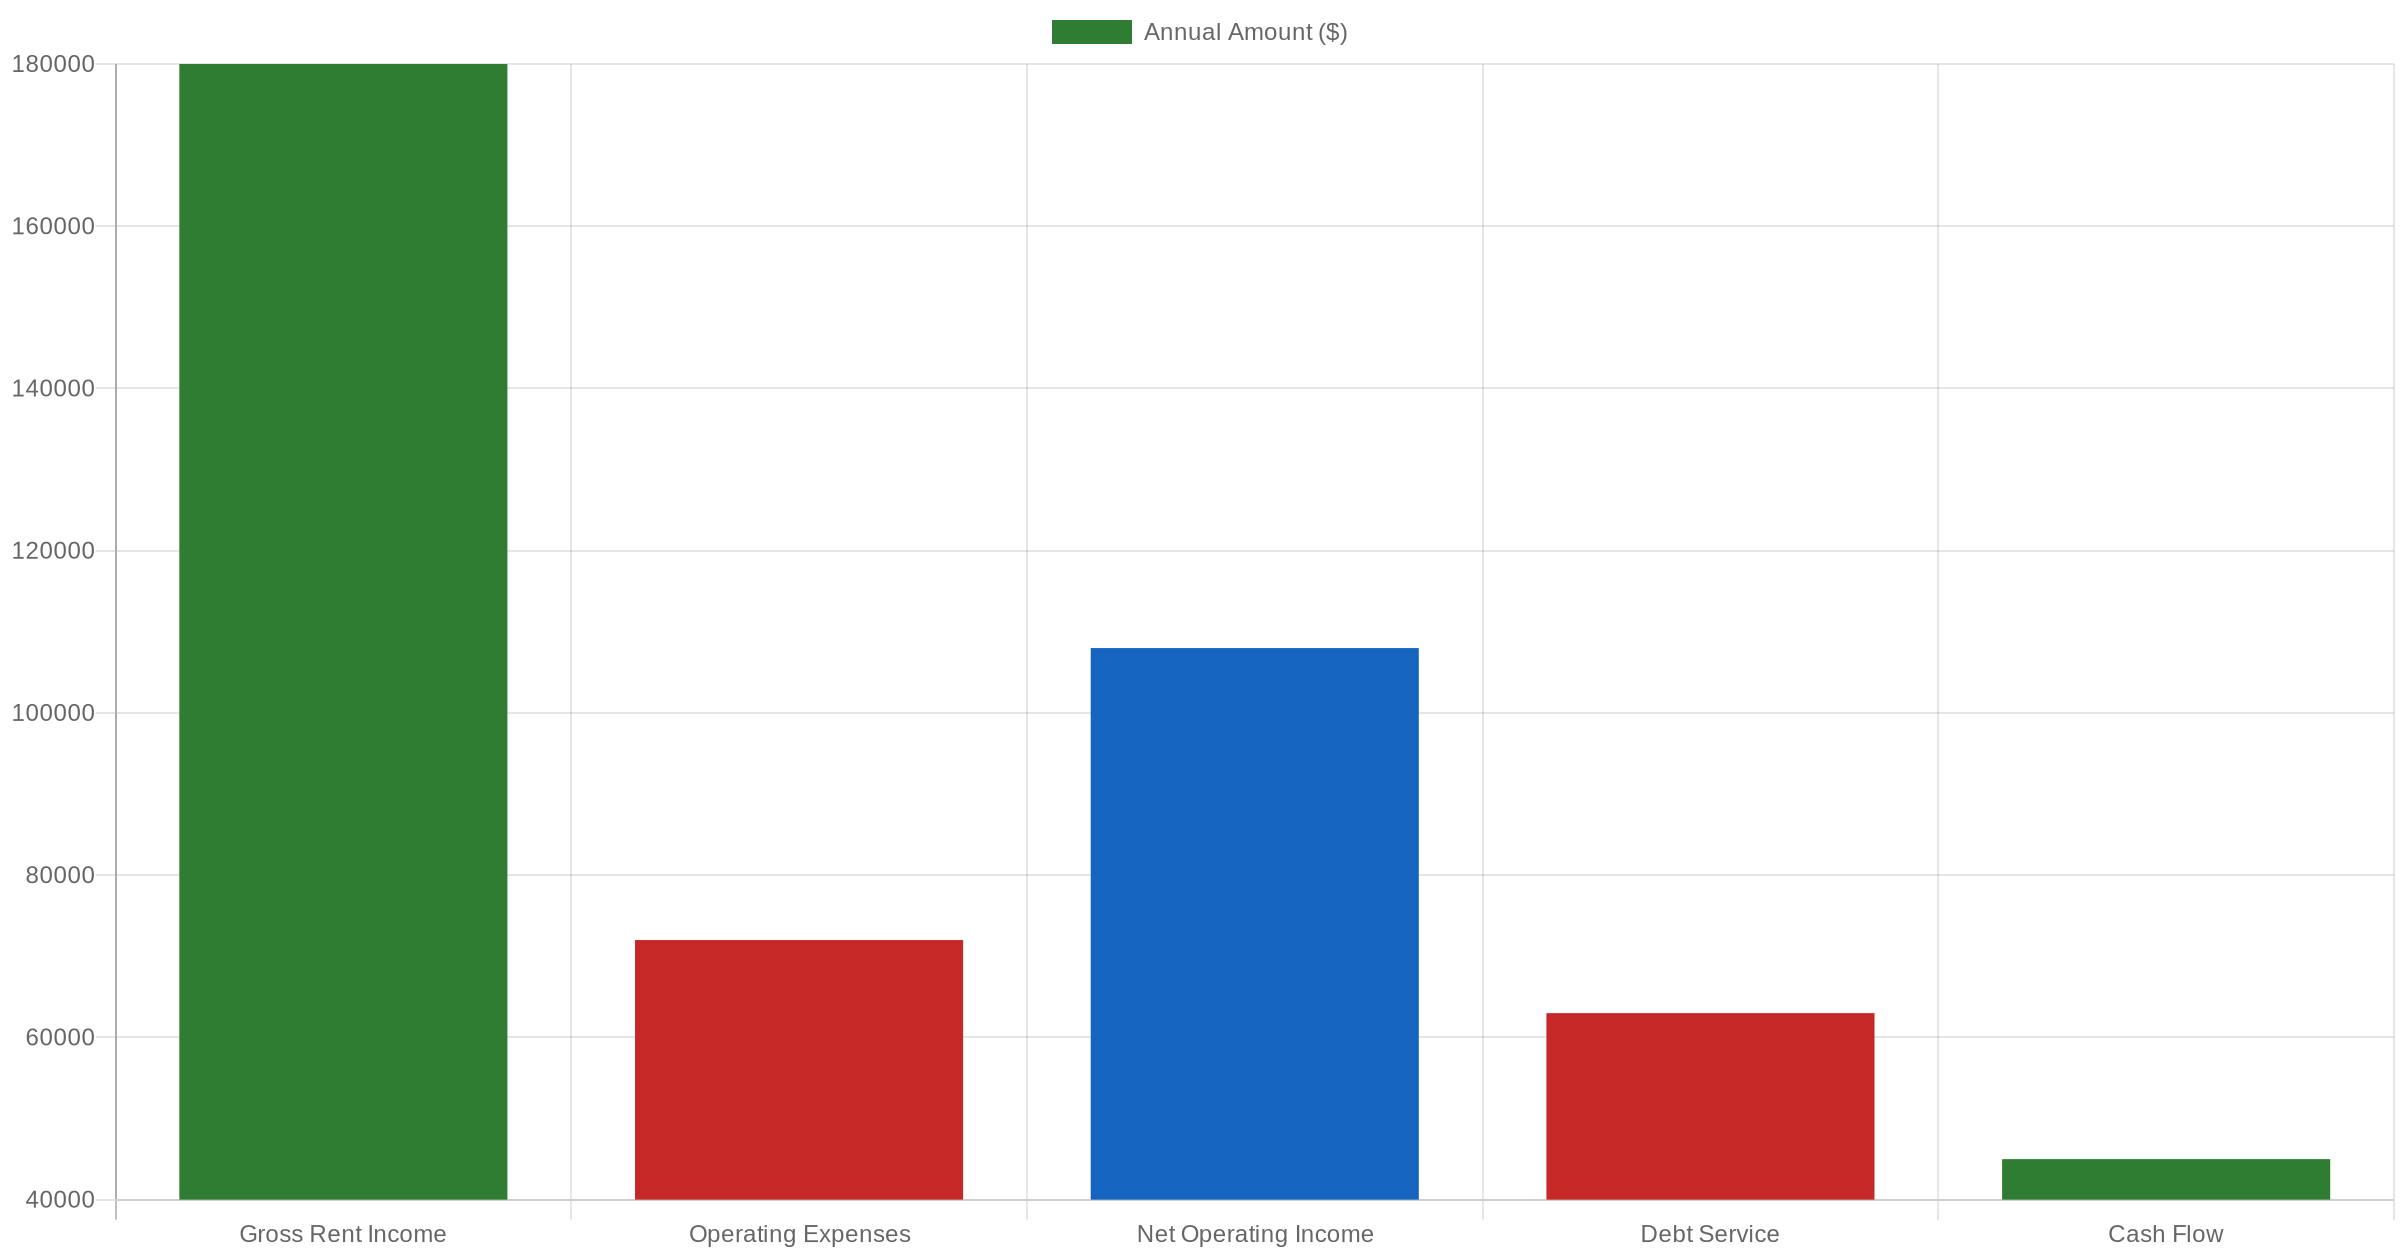
Let’s use a concrete example throughout this article: a 50-lot mobile home park in the Southeast with an average lot rent of $350/month and 90% occupancy.
- Occupied lots: 45 of 50
- Monthly gross income: 45 × $350 = $15,750
- Annual gross income: $189,000
Some parks also generate ancillary income from laundry facilities, storage units, or RV lots. For simplicity, we’ll focus on lot rent — which is the core income driver for most mobile home parks.
Step 2: Subtract Operating Expenses
Mobile home park operating expenses typically run between 30% and 45% of gross income, depending on the infrastructure setup. Parks on city water and sewer with tenant-owned homes tend to have the lowest expense ratios — sometimes as low as 30%. Parks with park-owned homes, private utilities, or deferred maintenance can run closer to 50%+.
Common operating expenses include:
- Property taxes: Varies by state and county; typically $500–$2,500/lot/year
- Insurance: General liability and property coverage for common areas and infrastructure
- Property management: On-site manager or third-party management fees (usually 8–12% of gross income)
- Water and sewer: If the park pays utilities directly (master-metered parks) before billing back to tenants
- Repairs and maintenance: Roads, common areas, utility infrastructure, landscaping
- Administrative: Accounting, legal, software, collections
- Capital reserves: Typically $150–$250/lot/year set aside for future capital expenditures
Using our 50-lot example with a 38% expense ratio:
- Annual operating expenses: $189,000 × 38% = $71,820
Step 3: Calculate Net Operating Income (NOI)
Net Operating Income (NOI) is the single most important metric in mobile home park investing. It tells you how much income the property generates before financing — and it drives the property’s market value.
NOI = Gross Income − Operating Expenses
In our example:
- NOI: $189,000 − $71,820 = $117,180
This is also the figure used to calculate cap rate: NOI ÷ Purchase Price. If this park sold for $1.2 million, the cap rate would be $117,180 ÷ $1,200,000 = 9.76% — a healthy return for a Southeast mobile home park market.
For a deeper look at how NOI and cap rates interact to determine value, see our guide: Mobile Home Park Cap Rates Explained: What’s a Good Cap Rate in 2026?
Before you analyze any deal’s cash flow, you need a system. The MHP Due Diligence Playbook includes 10 video modules, a 55-page master checklist, and 9 ready-to-use templates that walk you through every step of evaluating a mobile home park acquisition — including income verification, expense auditing, and pro forma modeling.
Two decades of hard-won lessons distilled into one free guide. Whether you’re evaluating your first deal or your fiftieth, these insights will sharpen your approach.
Step 4: Factor In Debt Service
Unless you’re purchasing a mobile home park all-cash, you’ll have a loan payment — referred to as debt service. This is where financing structure has an enormous impact on your actual cash flow.
Common mobile home park loan terms:
- Commercial bank loans: 5–7 year term, 20–25 year amortization, rates typically 6.5–8.0% (as of 2026)
- Agency financing (Fannie/Freddie): Longer terms available, competitive rates for stabilized parks with 50+ lots
- Seller financing: Negotiated terms; often used on smaller deals or where traditional financing is limited
In our example, assume a $900,000 loan (75% LTV on a $1.2M purchase) at 7.25% over 25 years:
- Monthly payment: ~$6,480
- Annual debt service: ~$77,760
Step 5: Arrive at Cash Flow After Debt Service
Cash flow — also called cash flow after debt service (CFADS) — is what remains after you’ve paid all operating expenses and made your loan payment.
Cash Flow = NOI − Annual Debt Service
- NOI: $117,180
- Annual debt service: $77,760
- Annual cash flow: $39,420
- Monthly cash flow: ~$3,285
Step 6: Calculate Your Cash-on-Cash Return
The cash-on-cash return tells you how much you’re earning relative to your actual cash invested (your down payment plus closing costs). It’s the most useful metric for comparing leveraged investments.
Cash-on-Cash = Annual Cash Flow ÷ Total Cash Invested
In our example:
- Down payment (25%): $300,000
- Estimated closing costs: $25,000
- Total cash invested: $325,000
- Cash-on-cash return: $39,420 ÷ $325,000 = 12.1%
A 12% cash-on-cash return is considered strong for any commercial real estate investment. And it doesn’t account for loan paydown, appreciation, or tax benefits — all of which add to total returns.
For a full breakdown of what passive investors can expect, read: What Returns Can You Expect from Passive Mobile Home Park Investments?
What Makes Mobile Home Park Cash Flow So Durable?
Several structural factors make mobile home park cash flow more predictable and recession-resistant than other asset classes:
Low Tenant Turnover
Moving a manufactured home is expensive — often $5,000–$10,000 or more. Tenants who own their home have enormous incentive to stay put, even through economic downturns. Annual turnover rates in mobile home parks typically run below 5%, compared to 40–50% in apartment buildings.
Low Operating Expenses
When tenants own their homes, operators aren’t responsible for interior maintenance, appliance replacement, or home-level capital expenditures. This keeps expense ratios dramatically lower than apartments or single-family rentals.
Lot Rent as Affordable Housing
Even as lot rents have grown across the Southeast and Midwest, mobile home park living remains one of the most affordable housing options in America. Demand is supply-constrained — almost no new mobile home parks are being built — which provides pricing power for operators while keeping units affordable relative to alternatives.
Value-Add Potential
Many mobile home parks are acquired from “mom and pop” operators who have kept rents well below market for years. A disciplined operator who brings lot rents to market rates and fills vacant lots can significantly increase NOI — and the property’s value — within 2–4 years of ownership. This rent-to-value growth is a primary driver of active mobile home park investor returns.
Cash Flow vs. Total Return: The Full Picture
Cash flow is only one component of total return in a mobile home park investment. Sophisticated investors track:
- Cash flow: Annual distributions from operations
- Loan paydown: Principal reduction each year builds equity passively
- Appreciation: NOI growth drives property value; a $10,000 increase in annual NOI at a 7% cap rate = $142,857 in added property value
- Tax benefits: Depreciation, cost segregation, and potentially bonus depreciation can shelter a significant portion of cash flow from federal income tax
For passive investors partnering with operators through a syndication, these benefits flow through to limited partners — typically via quarterly distributions and an equity share at the exit. Learn more at our guide to passive investing in mobile home parks.
Common Cash Flow Mistakes to Avoid
New investors regularly underestimate expenses or overestimate occupancy stabilization timelines. A few common pitfalls:
- Underestimating management costs: Even self-managed parks need an on-site manager. Budget 8–12% for management.
- Ignoring capital reserves: Infrastructure — roads, water lines, electrical — fails eventually. Budget $150–$250/lot/year.
- Assuming immediate stabilization: Filling vacant lots takes time. Model a realistic 12–24 month fill-up period.
- Not verifying actual rents: Always review 12 months of bank statements and rent rolls — not just what the seller tells you.
Get the MHP Due Diligence Playbook — the complete system for analyzing mobile home park acquisitions with confidence. Includes a 55-page master checklist, income and expense verification templates, and 10 video modules walking you through every step.
The Bottom Line
Mobile home park cash flow follows a straightforward path: gross lot rent income, minus operating expenses, equals NOI — then subtract debt service to get what you actually keep. What makes mobile home parks compelling is how much cash flow survives each step of that equation, thanks to low expense ratios, low turnover, and structural demand for affordable housing.
Whether you’re evaluating your first acquisition or considering passive exposure through a syndication, understanding how the cash flow mechanics work is the foundation everything else is built on.
If you’d like to learn more about mobile home park investing and how we approach acquisitions at Keel Team, reach out and we’d be happy to connect.
10 video modules, a 55-page master checklist, and 9 ready-to-use templates that walk you through every step of evaluating a mobile home park deal — from the first site visit to closing day.
Get the top 20 lessons from two decades of mobile home park investing — free.