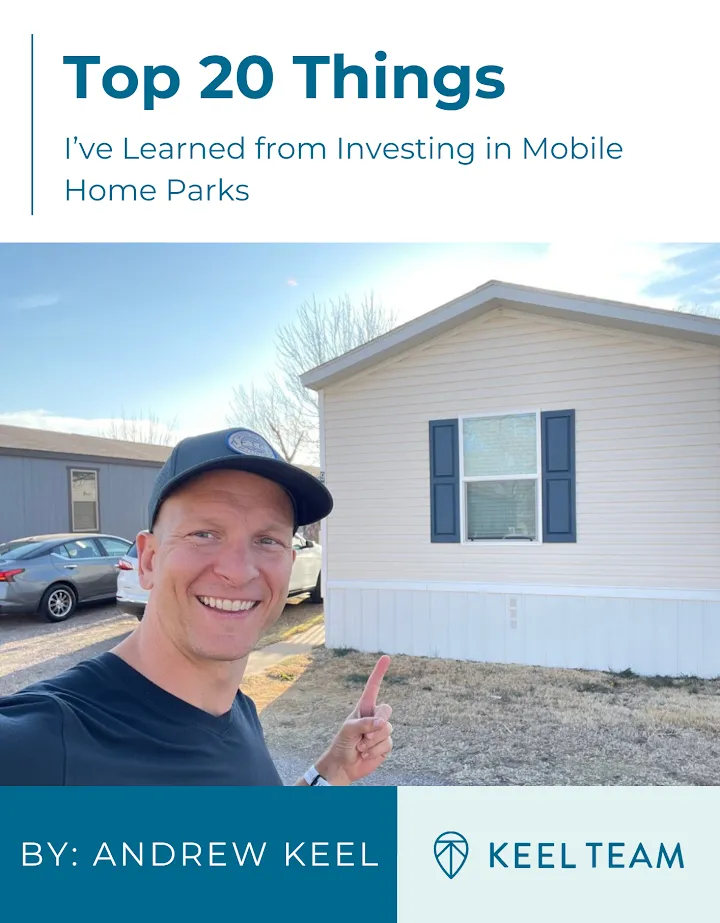
The Southeast manufactured housing community market enters 2026 with strong fundamentals: sustained population growth, significant below-market lot rents at most legacy communities, operator-friendly regulatory environments, and cap rates that still offer genuine return potential for disciplined buyers.
This report — compiled by Keel Team Real Estate Investments from primary market data, industry research, and our own transaction pipeline — covers the four states where we focus our acquisition activity: North Carolina, Tennessee, Georgia, and South Carolina.
Key Data Points
Average Southeast manufactured housing lot rent: ~$755/month (2025) vs. $1,800+ for comparable apartments
National manufactured home shipments up 161% since 2014 — new home supply supporting infill programs
Year-to-date cap rates averaged 5.9% nationally in mid-2025 (Northmarq)
South Carolina led the region with 13.3% lot rent growth in 2025
Approximately 85% of the 44,000 mobile home parks in America remain mom-and-pop owned
103,000+ manufactured homes shipped in 2024
North Carolina
North Carolina remains one of the most attractive states for manufactured housing investment in the Southeast. A combination of strong population inflows (particularly from the Northeast and Midwest), an operator-friendly regulatory environment, and no statewide rent control makes it a primary focus for Keel Team.
Lot rents: $450–$650/month across most markets; below-market at legacy communities
Cap rates: 5.5%–7.5% depending on market and asset quality
Regulatory environment: Operator favorable; NC Mobile Home Park Act governs notice requirements but does not restrict rent increases
Investment outlook H2 2026: Strong — continued population growth, limited new supply, significant mark-to-market opportunity
The Charlotte, Raleigh-Durham, and Triad MSAs continue to drive demand in surrounding secondary markets. Communities within 60 minutes of these population centers command premium rents and benefit from lower vacancy risk.
Tennessee
Tennessee offers a compelling combination of no state income tax, strong population growth (Nashville and Knoxville MSAs in particular), and a significant inventory of legacy communities with below-market rents. Secondary markets in East and Middle Tennessee represent meaningful opportunity for operators willing to look beyond the major metros.
Lot rents: $400–$600/month; significant mark-to-market in secondary markets
Cap rates: 5.5%–7.25%
No state income tax: A structural advantage for Tennessee-based income
Investment outlook H2 2026: Strong in secondary markets; major MSA communities are highly competitive
Georgia
Georgia presents a bifurcated market: communities in the Atlanta MSA and its suburbs are priced aggressively and face stiff institutional competition, while rural and secondary market communities offer more attractive entry points for value-add operators.
Lot rents: $450–$600/month; rural markets lower
Cap rates: 5.75%–7.5% depending on location
Atlanta MSA dynamics: High institutional interest; cap rate compression in well-located assets
Investment outlook H2 2026: Selective — best opportunities in secondary markets 60–90 minutes from major population centers
South Carolina
South Carolina led the Southeast in lot rent growth in 2025 at 13.3%, reflecting significant catch-up from historically low legacy rents. The state has seen notable population growth driven by coastal markets (Charleston, Myrtle Beach) and inland growth from Charlotte overflow. Cap rates are slightly higher than NC/TN, reflecting the smaller overall market and more limited liquidity.
Lot rents: $400–$550/month; below national averages
Cap rates: 6.0%–8.5%
Rent growth: 13.3% in 2025 — highest in the Southeast
Investment outlook H2 2026: Positive — continued rent growth expected as rents converge toward NC/TN levels
National Trends Affecting the Southeast
Supply Constraints Remain Structural
No meaningful new manufactured housing community supply has been added in the Southeast — or nationally — in decades. Zoning opposition, land costs, and infrastructure requirements make new park development economically unviable in most markets. The 44,000 existing parks are effectively the entire supply.
Manufactured Home Shipments Supporting Infill
103,000+ manufactured homes were shipped in 2024, up 161% since 2014. This has meaningfully improved the availability and cost of new homes for infill programs — a key value-add lever for operators with vacant lots.
Mom-and-Pop Transition Opportunity
Approximately 85% of mobile home parks nationally are still owned by individual operators, many of whom are approaching retirement age with no succession plan. This creates a sustained pipeline of off-market acquisition opportunities for operators with direct outreach programs and the ability to close without broker intermediary costs.
Regulatory Environment to Watch
The NC Mobile Home Park Act (effective 2023) introduced new resident protections including extended notice requirements for lot rent increases and community sales. While operator-friendly compared to states with rent control, it’s important for operators to stay current with state-specific regulatory changes. ROFR (right of first refusal) legislation has been introduced in several states, though not yet enacted in Keel Team’s primary markets.
H2 2026 Investment Outlook
The Southeast manufactured housing market remains one of the strongest regional opportunities for value-add real estate operators. Key factors supporting continued investment activity:
Below-market rents: Most legacy communities remain 20–40% below market rate, providing significant NOI growth runway without requiring occupancy improvement
Financing environment: Agency financing (Fannie/Freddie) remains available for stabilized communities; local/regional bank financing for value-add
Cap rate stability: Despite broader CRE cap rate pressure, MHP cap rates have held relatively stable due to strong NOI fundamentals
Institutional competition: Growing but still concentrated on larger (200+ lot) communities, leaving significant opportunity in the 70–150 lot segment
Andrew is a passionate commercial real estate investor, husband, father and fitness fanatic. His specialty is in acquiring and operating manufactured housing communities. Visit AndrewKeel.com for more details on Andrew's story.